
Abstract
Histomorphometric analysis of histologic sections of normal and diseased bone samples, such as healing allografts and fractures, is widely used in bone research. However, the utility of traditional semi-automated methods is limited because they are labor-intensive and can have high interobserver variability depending upon the parameters being assessed, and primary data cannot be re-analyzed automatically. Automated histomorphometry has long been recognized as a solution for these issues, and recently has become more feasible with the development of digital whole slide imaging and computerized image analysis systems that can interact with digital slides. Here, we describe the development and validation of an automated application (algorithm) using Visiopharm’s image analysis system to quantify newly formed bone, cartilage, and fibrous tissue in healing murine femoral allografts in high-quality digital images of H&E/alcian blue-stained decalcified histologic sections. To validate this algorithm, we compared the results obtained independently using OsteoMeasureTM and Visiopharm image analysis systems. The intraclass correlation coefficient between Visiopharm and OsteoMeasure was very close to one for all tissue elements tested, indicating nearly perfect reproducibility across methods. This new algorithm represents an accurate and labor-efficient method to quantify bone, cartilage, and fibrous tissue in healing mouse allografts.
Introduction
Accurate quantification of the histologic appearances of tissue sections is an important end-point of many biological research studies and typically involves histomorphometric analysis of large numbers of histology slides. Semi-automated histomorphometric image analysis systems have been developed since the advent of readily available desktop computers in the 1970s when bone biopsy and bone histomorphometry became established research and clinical methods. These include the OsteoMeasure and Bioquant® image analysis systems, which are used widely in the musculoskeletal field1–7 and have largely replaced the use of point counting and line intersect measurement with a microscope eyepiece grid, which was the gold standard against which semi-quantitative methodologies were compared.4,8–11
OsteoMeasure (OsteoMetrics, Atlanta, GA, USA)1,2 and Bioquant5–7 are two well-established computer-assisted, semi-automated image analysis systems used routinely for bone histomorphometry. Both systems use a camera mounted on a microscope to transfer images of fields of interest in slides to a computer monitor. An electronic drawing pad and an attached mouse or pen is used to trace the surface profiles of the various elements in the field of view. The various components of the surfaces (e.g., those covered by osteoblasts, osteoclasts, or bone lining cells) can be assigned sequentially as each individual trabecula or area of cartilage is traced one by one until all elements of the image have been drawn. Quantitative data of each surface element of the tissue are generated automatically along with the total area of these elements. The tracings and data are saved and can be viewed later, but the tracings cannot be modified to correct any interpretative or other errors. Although OsteoMeasure and Bioquant can provide very accurate data, the technique is time-consuming and labor-intensive and requires good hand–eye coordination and concentration during the acquisition of data.
Despite the obvious advantages of semi-automated image analysis systems, they remain limited by their inability to allow automated reanalysis of primary data and their time-consuming nature. The combination of a logarithmic increase in computer processing power, the availability of high-quality digital cameras, and the ability to make fully digitized images of histologic slides using whole slide imaging systems has made it possible to get closer to fully automated image analysis.12–14 Here we describe the development and validation of an Olympus VS-120 digital whole slide imaging system and Visiopharm’s computer-based image analysis system to make an automated histomorphometric analysis algorithm of the key elements of healing murine femoral allographs after minimal initial manipulation of the digital images.
Materials and methods
Histology and histomorphometry methods
Femora from mice with healing allografts were fixed in 10% phosphate-buffered formalin, decalcified in 10% EDTA, and processed through paraffin, as described previously.15–19 Briefly, the slides were treated at room temperature in the following order with (i) 1% acid alcohol (1% hydrochloric acid made in 70% ethyl alcohol) for 30 s; (ii) Alcian blue/hematoxylin solution (0.5% hematoxylin, 5% aluminum ammonium sulfate, 0.05% sodium iodate, 0.5% Alcian blue, 50% glycerol, 0.02% glacial acetic acid) for 30 min; (iii) distilled water (washing 1 time); (iv) 1% acid alcohol for 2–3 s; (v) distilled water (washing 1 time); (vi) 0.5% ammonium water for 15 s; (vii) distilled water (washing 1 time); (viii) 95% alcohol for 1 min; (ix) eosin–orange G (1.2% eosin in 90% alcohol plus 1% phloxine B and 2% orange G) for 1 min 30 s; (x) 95% alcohol for 3 min; and the slides were mounted with Permount (VWR Scientific, South Plainfield, NJ, USA).18–20 Cartilage stains blue, bone orange-red, muscle red, bone marrow and matrix-synthesizing osteoblasts lilac, and new fibrous tissue orange-red.
The same slides were analyzed using two methods: OsteoMeasure and Visiopharm image analysis systems. A Zeiss Axioskop 40 microscope was used, and images of slides were transferred from the microscope to a computer using a video camera for assessment using OsteoMeasure. For Visiopharm assessment, the glass slides were converted to virtual slides (digital files) with an Olympus VS-120 whole slide scanner and these were analyzed with a Visiopharm Algorithm (protocol) developed by Longze Zhang, the first author of this paper, by using the Visiopharm Image Analytical System (Version: 5.0.3.1309). We used the same sections from a group of five control samples used in a previous study in which five samples were shown to be sufficient to achieve statistically significant differences for comparisons between allograft and autograft and when we used pharmacologic intervention to try to improve healing.19 The analyses were repeated and carried out in a blinded fashion by two users (the lead and second authors of the paper) using OsteoMeasure and Visiopharm, respectively. For OsteoMeasure, we tried both manual (drawing) and automatic (thresholding) modes. We found that the automatic mode required too much manual correction and took longer than the manual mode per slide and used the former method for our comparison studies.
Development of the Visiopharm healing allograft algorithm
Challenges developing the algorithm
We have used the OsteoMeasure image analysis system in our Center for Musculoskeletal Research (CMSR) for many years to quantify newly formed bone, cartilage, and fibrous tissue in murine allograft and fracture callus and in other animal models of bone repair.3,19,21–23 However, OsteoMeasure is labor-intensive and time-consuming, and thus we purchased a Whole Slide Imaging System and Visiopharm software to allow us to develop algorithms/protocols that would help us attempt to automate these and other measurements. The Olympus VS120 system comprises a conventional light and fluorescent motorized microscope and a robotic device, which takes slides from one of two slide loaders (each holds up to 50 glass slides) for high-throughput scanning. After loading, slides are scanned automatically in sequence, and virtual slides are created and stored in an attached server. The histologic features of these digital slide files, each of which can be several gigabytes depending upon the area scanned and the magnification, can be analyzed using the Visiopharm software. The Visiopharm system, which provides automated, comprehensive color recognition, stereology-based image analysis, and stereological tools for unbiased quantification, has been used extensively in recent years by numerous clinical, academic, and biotech/pharmaceutical research groups.13,24–26 The ALGORITHM authoring tools within the program provide a range of multivariate classifiers that can use multispectral color information, as well as spatial, morphologic, and textural features as input.
The goal of our Visiopharm Algorithm was to automate or semi-automate analysis of features of sections stained using a modified H&E staining method we developed for sections containing cartilage (Figure 1, area 1), newly formed bone (Figure 1, area 2), newly formed fibrous tissue (Figure 1, area 3), bone marrow (Figure 1, area 4), and newly formed osteoblastic tissue (Figure 1, area 5). We developed this Visiopharm Algorithm on the basis of color recognition. In Figure 2, cartilage is consistently stained blue at low (Figure 2a, area 1) and at higher magnification (Figure 2b). However, there is overlap in the red color spectrum between bone (Figure 2a, area 2, Figure 2c) and fibrous tissue (Figure 2a, area 3, Figure 2d), which can be seen clearly at higher magnification. Similarly, there is overlap between the color of bone marrow (Figure 2a, area 4, Figure 2e), matrix-synthesizing osteoblasts (Figure 2a, area 5, Figure 2f), and newly formed fibrous tissue (Figure 2a, area 3). Therefore, although fibrous tissue (Figure 2a, area 3), osteoblasts (Figure 2a, area 5), and bone marrow (Figure 2a, area 4) comprise different cell types, the color overlap among them makes it difficult initially to accurately distinguish among them and to assign separate color labels to them with the Visiopharm software. Consequently, fibrous tissue, osteoblastic tissue, and bone marrow labeled similarly (called cross-labeling) during the initial automated color assignment (Figure 3a for low power and Figure 3b, c for close-up view). Although it is possible to perform a manual labeling modification after automated labeling, this could be quite time-consuming if numerous changes must be made (Figure 3a–c), and thus it might not be an improvement over the OsteoMeasure or Bioquant methods.

Healing murine femoral allograft. A representative virtual slide (image) of a part of a healing murine femoral allograft generated using an Olympus VS-120 scanner and showing areas of interest for quantification: newly formed cartilage (area 1), newly formed bone (area 2), new fibrous tissue (area 3), bone marrow (area 4), and new osteoblastic tissue (area 5). H&E, orange G/alcian blue staining; ×2.5 magnification.

Challenges developing the algorithm. (a) Higher magnification of part of the image in Figure 1 illustrating some overlapping of colors among the different tissues. Area 1: New cartilage; Area 2: New bone; Area 3: New fibrous tissue; Area 4: Bone marrow; Area 5: New osteoblastic tissue; ×10 magnification. (b–f) Higher magnification (×2 560, 6 400% zoom in with Visiopharm) pixel-level view of cartilage (area 1 in a); bone (area 2 in a); fibrous tissue (area 3 in a); bone marrow (area 4 in a); and osteoblastic tissue (area 5 in a), respectively.

After primary segmentation, overlap of color spectra illustrates mislabeling of some tissues. (a) Primary segmentation showing labeling of tissues in a defined part a healing allograft; cartilage (blue), bone (red), new fibrous tissue (pink), and bone marrow (also pink) and new osteoblastic tissue (purple) (×4). (b) A close-up view (×40) of new osteoblastic tissue and bone marrow showing mislabeling of some of bone marrow as fibrous tissue; (c) a close-up view (×40) of new fibrous tissue showing mislabeling of some of it as new osteoblastic tissue. Blue is assigned to cartilage, red to bone, purple to osteoblastic tissue, and pink to new fibrous tissue and bone marrow.
Solution for mesenchyme and bone marrow cross-labeling. On further experimentation, it was clear that a major difference between new fibrous tissue and bone marrow and new osteoblastic tissue in these healing allografts is that, unlike these latter tissues, fibrous tissue typically is present as larger areas. Thus, we reasoned that if we merge these three tissues together and then define fibrous tissue based on size, we might be able to avoid the cross-labeling and subsequently more accurately define fibrous tissue (Figure 2a, area 3) and distinguish it from bone marrow (Figure 2a, area 4) and osteoblastic tissue (Figure 2a, area 5). Meanwhile, as bone marrow and new osteoblastic tissue areas typically are not quantified by researchers in this model, no separation is needed between them. Thus, they were assigned the same color (purple), which made development of the algorithm easier. Based on this rationale and experimentation, we developed this algorithm. We tested it initially within a small region of interest (ROI) shown in Figure 3 and found that most areas were labeled properly, resulting in much less mislabeling for manual correction (Figure 4a), compared with the labeling without this algorithm (shown in Figure 3a). Consequently, satisfactory labeling was generated after a short period (typically ∼5 min per slide overall) of manual correction (Figure 4b).

Tissue labeling before and after manual correction/modification. (a) Primary segmentation of the part of the allograft in Figure 3a showing three areas (*) where bone marrow and new osteoblastic tissue have been manually assigned to purple (×4). (b) The same image from (a) where a fourth area (*) has been reassigned from new fibrous tissue to new osteoblastic tissue/bone marrow to complete the manual manipulation before final quantification by the algorithm.
Development and use of the algorithm
The development of the algorithm was divided into three steps:
Step 1: color segmentation
-
1
Color training: Assign a color to a tissue by drawing small areas over it using the mouse. As more areas of the tissue type are sampled, the program “learns” the range of colors within that tissue and more accurately assigns similarly stained areas in the ROI to that tissue type. Finish color assignment for all tissues (Figure 5a). Color training can be saved and used for the next slide/image.
Figure 5 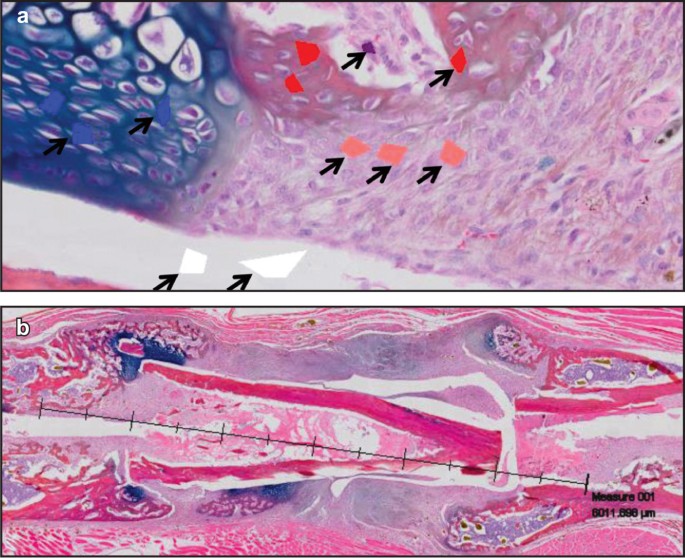
Color training and ROI Size Standard Bar setting. (a) Color training of the algorithm. Small representative areas of different tissues are drawn and assigned different colors (arrows) (×4). Visiopharm software will follow this training to label similarly stained tissues. (b) ROI Size Standard Bar setting (×1.25). For each sample, the length of this bar should be the same.
-
2
Draw a scale defining a length “ROI Size Standard Bar” (this standard length includes the repair tissues along the length of the allograft and extends onto the host bone at either end to a set distance defined by the user) (Figure 5b).
-
3
Define the ROI covering the “ROI Size Standard Bar”, to include all tissues, excluding pre-existing cortical bone, allograft, and muscle (Figure 6a).
Figure 6 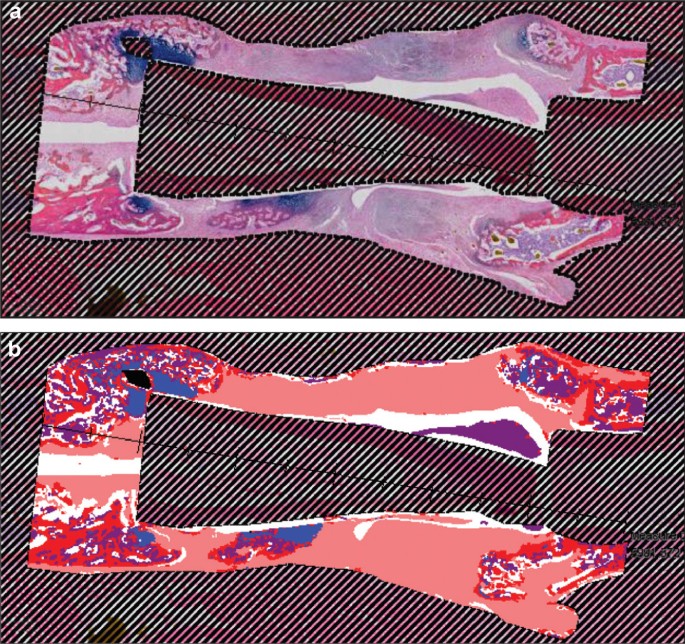
ROI drawing and primary color segmentation. (a) The ROI is defined based on the Size Standard Bar to include the callus on either side of the femoral shaft and allograft, excluding muscle, allograft, and pre-existing cortical bone (×1.25); (b) Primary color segmentation generated after running step 1 of the algorithm (×1.25).
-
4
Run step 1 by clicking on the Run button, and a preliminary color segmentation is generated (Figure 6b).


During step 1, the following steps would be run automatically:
- a
Initial color segmentation for all tissues;
- b
Fill holes (unstained area) in cartilage: to include chondrocytes and their lacunae in cartilage;
- c
Change fibrous tissue to bone marrow: merge these two tissues together and split into area units for later processing;
- d
Change bone marrow between 30 000 and 200 000 μm2 to fibrous tissue.
- e
Ignore clear areas (which are called background in this algorithm) in the slide where marrow or cells have pulled away from bone or cartilage as sectioning/staining artifacts.
Step 2: Manual correction/modification
Manual correction is needed in most cases to achieve more accurate quantification (Figure 7a). As the labels have been split into units, in most cases it is not necessary to draw around tissue elements with complex textures. The user simply needs to hold the Ctrl key and left click with the mouse on tissue elements to include them in the particular tissue type. After manual correction, satisfactory labeling is achieved (Figure 7c).

Manual correction/modification. (a) An area from the bottom right of (b) in Figure 6 where there is mislabeling of bone marrow as new fibrous tissue (labeled pink); (b) The corresponding area in the original image for reference to (a); (c) Final labeling after manual correction/modification for comparison with (b) in Figure 6.
Step 3: Quantification and data generation
This step will automatically measure the areas of tissues and generate the data output.
Statistical analysis
Differences (in Tables 1–6) were calculated as “value with Visiopharm – value with OsteoMeasure”. Reproducibility across methods was assessed using intraclass correlation coefficients (ICCs).27 Corresponding 95% confidence intervals (CIs) for the ICCs were computed using the exact method.28 An ICC less than 0.4 indicated poor reproducibility, between 0.4 and 0.75 indicated fair to good reproducibility, and an ICC above 0.75 indicated excellent reproducibility.29 Data analyses were performed by using SAS software, version 9.3 (SAS Institute, Cary, NC, USA).
Results
Validation of the Visiopharm algorithm
To validate this new Algorithm that we developed to analyze the various elements that comprise healing allografts, the same ROI in virtual slides and in the glass slides that had been converted into virtual slides were analyzed blindly using the Visiopharm Algorithm and a week later (allowing a “washout” period) OsteoMeasure. These areas were selected in each of the slides to include all of the healing tissues, including cartilage, new bone, and fibrous tissue. The results acquired using the two different methods for newly formed bone (Tables 1 and 4), cartilage (Tables 2 and 5), and fibrous tissue areas (Tables 3 and 6) were compared.
For new bone area, the ICC (95% CI) value for the comparison between Visiopharm and OsteoMeasure is 0.994 3 (0.958 5–0.999 4) (Table 7). With new bone area expressed as a percentage, the ICC (95% CI) value is 0.989 2 (0.922 9–0.998 8). For cartilage area, the ICC (95% CI) value for the comparison between Visiopharm and OsteoMeasure is 0.979 9 (0.860 7–0.997 8) (Table 7). With the cartilage area expressed as a percentage, the ICC (95% CI) value is 0.994 6 (0.961 1–0.999 4). For fibrous tissue area, the ICC (95% CI) value for comparison between Visiopharm and OsteoMeasure is 0.979 5 (0.857 6–0.997 8) (Table 7). With the fibrous tissue area expressed as a percentage, the ICC (95% CI) value is 0.9822 (0.875 6–0.998 1).
Linear regression analysis was performed between Visiopharm and OsteoMeasure, in terms of new bone (Figure 8), cartilage (Figure 9), and fibrous tissue area (Figure 10). From Figures 8, 9, and 10, all the regression lines fit the data very well and indicate that the differences between Visiopharm and OsteoMeasure are very small and unbiased. The R2 values for the linear regression analysis between Visiopharm and OsteoMeasure in terms of new bone, cartilage, and fibrous tissue area are 0.977 5, 0.987 5, and 0.956 5, respectively. The R2 values indicate that the Visiopharm data are very closely related to those of OsteoMeasure, and the corresponding ICC values (Table 7) indicate nearly perfect agreement.

Linear regression analysis for new bone area between OsteoMeasure and Visiopharm.

Linear regression analysis for cartilage area between OsteoMeasure and Visiopharm.

Linear regression analysis for fibrous area between OsteoMeasure and Visiopharm.
Discussion
OsteoMeasure and Bioquant are two well-established bone histomorphometric systems, which numerous investigators have used for estimation of tissue areas/volumes for many years. Point-counting was used extensively from the 1960s to the 1980s before desktop computers became widely available and was the gold standard against which new methodologies were measured because of its proven accuracy in numerous morphologic settings.4,8–11,30 Image analysis systems, such as OsteoMeasure and Bioquant, were developed in the 1980s to harness the capabilities of computer-assisted image analysis, and their software has been upgraded regularly since then. The development of these semi-automatic image analysis systems using a microscope, camera, and drawing equipment allowed users to trace around the surfaces of the various elements of tissues, and thus permit automated calculation of areas and volumes of these elements as well as their surface extents. The bone outlines drawn using these systems can be stored and re-examined later for review of accuracy of the data, but the histologic image is not retained with these two methods. However, both methods are labor-intensive with some disadvantages compared with the Visiopharm Software System (Table 8). In addition to the typical manual mode, OsteoMeasure also has an automatic segmentation mode (thresholding). Automatic segmentation could save significant time over the manual mode in cases where there are only two colors, such as Von Kossa-stained undecalcified sections of bone with normal mineralization where bone matrix is black and other tissues may be counterstained red. However, in cases, such as our healing allografts, where there are multiple colors and significant color overlap between tissues or/and complicated intermingling of tissue elements, OsteoMeasure automatic segmentation (thresholding) would require excessive manual modification. We tried this option with OsteoMeasure using some of our slides and found that this took longer to complete than the typical manual mode (∼60 min per slide) that we have been using for several years.
Compared with OsteoMeasure, Visiopharm has several advantages as a computer-assisted automated/semi-automated image analysis system compared with the above well-established computer-assisted methods. First, after initial training, the interface can be operated easily by users. Second, manual adjustments to increase accuracy of the measurements are minimal and straightforward and can be performed quickly. Third, the analysis can be saved for later review or any additional modifications that may be indicated. Last, and most importantly, the Visiopharm system has the ability to perform batch processing and compensate for histochemical stain variability within a batch analysis by importing the whole folder containing images for analysis and then running a batch analysis. For example, the average times taken by the lead author to measure the three elements of healing allografts were 5 and 60 min using Visiopharm and OsteoMeasure, respectively, and those of a histomorphometrist experienced with the use of OsteoMeasure, but a new Visiopharm user, were 8 and 60 min, respectively. The relatively longer time spent with Visiopharm by the new user is mainly due to increased time spent setting modifications while matching the variance between slides/batches. However, with the exception of this time difference, the results from different users (the lead author and the second author) are very consistent (data not shown). Our statistical analysis indicates that the data collected from OsteoMeasure and Visiopharm show a very high level of reproducibility. Moreover, because the lower limit of each of the 95% CIs exceeds 0.75, it can be concluded that each ICC is significantly higher than the threshold for excellent reproducibility. Thus, this Visiopharm Algorithm provides an efficient method for histomorphometry and accuracy similar to OsteoMeasure analysis.
Despite the significant reduction in time taken for the histomorphometry, there are some limitations to whole slide imaging and the Visiopharm System. For example, although Visiopharm could be a good replacement for traditional morphometric systems, unless all of the elements in a slide stain differently, some image adjustments have to be made on each slide. While the color training from previous slides can be saved for future use and a significant amount of time could be saved, new color training session is needed in cases where the segmentation is not satisfactory or staining variance between slides (images) is significant. In addition, the algorithm also provides users the option to change the setting of the application to match the variance in tissue texture between slides/batches. The time required for these, however, can be minimal.
The Visiopharm system is significantly more expensive than OsteoMeasure and Bioquant, and it has higher minimum requirements for both hardware and software. A less expensive option can be to rent Apps from Visiopharm for a period of days or weeks when large batches of images could be quantified. A Whole Slide Imaging system (for example, the VS-120 from Olympus, the Aperio CS2 from Leica Biosystems, the NanoZoomer-XR C12000 from Hamamatsu, the Mikroscan D2 from Mikroscan, and the iScan HT from Ventana) is required to convert glass slides into virtual slides (images), and all these systems are expensive. However, some systems, such as the NanoZoomer-XR C12000 can scan up to 320 standard slides automatically in one batch and do not need an operator to attend the device during scanning, which can be done overnight. In addition, some of these systems can also scan using fluorescence lenses, meaning that scanned immunofluorescent digital slides will not fade or quench on repeat viewing, as happens typically to the original glass slides, and thus they can be viewed repeatedly. The Visiopharm system could be used for the standard dynamic histomorphometric analysis of human or rodent undecalcified bone sections with double fluorescence labeling scanned using a whole slide imaging system with fluorescence capability, such as the Olympus VS120. We have developed a separate algorithm for this application.
In summary, to meet the growing need for automation in bone histomorphometry of healing allografts, we have developed and validated a Visiopharm Algorithm for H&E, orange G/alcian blue-stained sections of healing mouse allografts and have shown that it compares well with an established semi-quantitative histomorphometric method. We conclude that this Visiopharm Algorithm is an efficient and accurate tool for assessing new bone, cartilage, and fibrous tissue in this model that can be used with currently available software. The algorithm could be applied to healing fractures, which have similar tissue elements.
References
Gruber HE . OsteoMeasure. Biotechnol Software J 1995; 12: 30–31.
Priemel M, von Domarus C, Klatte TO et al. Amling. Bone mineralization defects and vitamin D deficiency: histomorphometric analysis of iliac crest bone biopsies and circulating 25-hydroxyvitamin D in 675 patients. J Bone Miner Res 2010; 25: 305–312.
Wu Q, Kim KO, Sampson ER et al. Induction of an osteoarthritis-like phenotype and degradation of phosphorylated Smad3 by Smurf2 in transgenic mice. Arthritis Rheum 2008; 58: 3132–3144.
Hordon LD, Raisi M, Aaron JE, Paxton SK, Beneton M, Kanis JA . Trabecular architecture in women and men of similar bone mass with and without vertebral fracture: I. Two-dimensional histology. Bone 2000; 27: 271–276.
Akhter MP, Lappe JM, Davies KM, Recker RR . Transmenopausal changes in the trabecular bone structure. Bone 2007; 41: 111–116.
Sabatini M, Boyce B, Aufdemorte T, Bonewald L, Mundy GR . Infusions of recombinant human interleukins 1 alpha and 1 beta cause hypercalcemia in normal mice. Proc Natl Acad Sci U S A 1988; 85: 5235–5239.
Miller MM, Billiar RB . A quantitative and morphometric evaluation of 125I-alpha-bungarotoxin binding in the rat hypothalamus. Brain Res Bull 1986; 16: 681–688.
Fong TP, Okafor LA, Schmitz TH, Thomas W, Westerman MP . An evaluation of cellularity in various types of bone marrow specimens. Am J Clin Pathol 1979; 72: 812–816.
von Wowern N, Melsen F . Comparative bone morphometric analysis of mandibles and iliac crests. Scand J Dent Res 1979; 87: 351–357.
Minaire P, Berard E, Meunier PJ, Edouard C, Goedert G, Pilonchery G . Effects of disodium dichloromethylene diphosphonate on bone loss in paraplegic patients. J Clin Invest 1981; 68: 1086–1092.
Boyce BF, Fell GS, Elder HY et al. Hypercalcaemic osteomalacia due to aluminium toxicity. Lancet 1982; 2: 1009–1013.
Grunkin M, Raundahl J, Foged NT . Practical considerations of image analysis and quantification of signal transduction IHC staining. Methods Mol Biol 2011; 717: 143–154.
Vassiliadis E, Veidal SS, Barascuk N et al. Measurement of matrix metalloproteinase 9-mediated collagen type III degradation fragment as a marker of skin fibrosis. BMC Dermatol 2011; 11: 6.
Vassiliadis E, Larsen DV, Clausen RE et al. Measurement of CO3-610, a potential liver biomarker derived from matrix metalloproteinase-9 degradation of collagen type iii, in a rat model of reversible carbon-tetrachloride-induced fibrosis. Biomark Insights 2011; 6: 49–58.
Gerber HP, Vu TH, Ryan AM, Kowalski J, Werb Z, Ferrara N . VEGF couples hypertrophic cartilage remodeling, ossification and angiogenesis during endochondral bone formation. Nat Med 1999; 5: 623–638.
Hughes DE, Dai A, Tiffee JC, Li HH, Mundy GR, Boyce BF . Estrogen promotes apoptosis of murine osteoclasts mediated by TGF-beta. Nat Med 1996; 2: 1132–1136.
Mundy G, Garrett R, Harris S et al. Stimulation of bone formation in vitro and in rodents by statins. Science 1999; 286: 1946–1949.
Dhillon RS, Zhang L, Schwarz EM, Boyce BF, Xie C . The murine femoral bone graft model and a semiautomated histomorphometric analysis tool. Methods Mol Biol 2014; 1130: 45–59.
Dhillon RS, Xie C, Tyler W et al. PTH-enhanced structural allograft healing is associated with decreased angiopoietin-2-mediated arteriogenesis, mast cell accumulation, and fibrosis. J Bone Miner Res 2013; 28: 586–597.
Zhang X, Schwarz EM, Young DA, Puzas JE, Rosier RN, O’Keefe RJ . Cyclooxygenase-2 regulates mesenchymal cell differentiation into the osteoblast lineage and is critically involved in bone repair. J Clin Invest 2002; 109: 1405–1415.
Engin F, Yao Z, Yang T et al. Dimorphic effects of Notch signaling in bone homeostasis. Nat Med 2008; 14: 299–305.
David MA, Jones KH, Inzana JA, Zuscik MJ, Awad HA, Mooney RA . Tendon repair is compromised in a high fat diet-induced mouse model of obesity and type 2 diabetes. PLoS One 2014; 9: e91234.
Ito H, Koefoed M, Tiyapatanaputi P et al. Remodeling of cortical bone allografts mediated by adherent rAAV-RANKL and VEGF gene therapy. Nat Med 2005; 11: 291–297.
Brügmann A, Eld M, Lelkaitis G et al. Digital image analysis of membrane connectivity is a robust measure of HER2 immunostains. Breast Cancer Res Treat 2012; 132: 41–49.
Laurinaviciene A, Dasevicius D, Ostapenko V, Jarmalaite S, Lazutka J, Laurinavicius A . Membrane connectivity estimated by digital image analysis of HER2 immunohistochemistry is concordant with visual scoring and fluorescence in situ hybridization results: algorithm evaluation on breast cancer tissue microarrays. Diagn Pathol 2011; 6: 87.
Lawhorn C, Edusei E, Zhou Y, Ho A, Kreek MJ . Acute binge pattern cocaine administration induces region-specific effects in D1-r- and D2-r-expressing cells in eGFP transgenic mice. Neuroscience 2013; 253: 123–131.
Searle SR . Linear models. Wiley: New York, USA, 1971.
Thomas JD, Hultquist RA . Interval estimation for the unbalanced case of the one-way random effects model. Ann Statist 1978; 6: 582–587.
Fleiss JL . The design and analysis of clinical experiments. Willey: New York, USA, 1986.
Shen V, Dempster DW, Birchman R, Xu R, Lindsay R . Loss of cancellous bone mass and connectivity in ovariectomized rats can be restored by combined treatment with parathyroid hormone and estradiol. J Clin Invest 1993; 91: 2479–2487.
Acknowledgements
We thank Yanyun Li and Zhenqiang Yao from the Department of Pathology and Laboratory Medicine, University of Rochester for their help and suggestions, Ashish Thomas from the Center for Musculoskeletal Research, University of Rochester for help scanning slides with the Olympus VS-120 slide scanner; and Torbjoern Kristensen and Martin Axelsen from Visiopharm Company for their help with the Visiopharm software. This project is funded by grants (1S10RR027340-01 and AR43510) to BFB, and (R01 DE019902, P30 AR061307 and P50 AR054041) to EMS, from the National Institutes of Health.
Author information
Authors and Affiliations
Corresponding author
Ethics declarations
Competing interests
The authors declare no conflict of interest.
Rights and permissions
This work is licensed under a Creative Commons Attribution NonCommercial-NoDerivs 4.0 Unported License. The images or other third party material in this article are included in the article's Creative Commons license, unless indicated otherwise in the credit line; if the material is not included under the Creative Commons license, users will need to obtain permission from the license holder to reproduce the material. To view a copy of this license, visit http://creativecommons.org/licenses/by-nc-nd/4.0/
About this article

Cite this article
Zhang, L., Chang, M., Beck, C. et al. Analysis of new bone, cartilage, and fibrosis tissue in healing murine allografts using whole slide imaging and a new automated histomorphometric algorithm. Bone Res 4, 15037 (2016). https://doi.org/10.1038/boneres.2015.37
Received:
Revised:
Accepted:
Published:
DOI: https://doi.org/10.1038/boneres.2015.37
This article is cited by
-
Computational pathology for musculoskeletal conditions using machine learning: advances, trends, and challenges
Arthritis Research & Therapy (2022)
-
Contemporary Advances in Computer-Assisted Bone Histomorphometry and Identification of Bone Cells in Culture
Calcified Tissue International (2022)
-
Cell engraftment, vascularization, and inflammation after treatment of equine distal limb wounds with endothelial colony forming cells encapsulated within hydrogel microspheres
BMC Veterinary Research (2020)
