
Abstract
Highly polymorphic microsatellite markers are widely employed in population genetic analyses (eg, of biological parentage and mating systems), but one potential drawback is the presence of null alleles that fail to amplify to detected levels in the PCR assays. Here we examine 233 published articles in which authors reported the suspected presence of one or more microsatellite null alleles, and we review how these purported nulls were detected and handled in the data analyses. We also employ computer simulations and analytical treatments to determine how microsatellite null alleles might impact molecular parentage analyses. The results indicate that whereas null alleles in frequencies typically reported in the literature introduce rather inconsequential biases on average exclusion probabilities, they can introduce substantial errors into empirical assessments of specific mating events by leading to high frequencies of false parentage exclusions.
Introduction
Null alleles have posed recurring challenges for population genetics following the introduction and application of each new method of molecular assay (including serological typing, protein electrophoresis, RFLPs, and now microsatellites). One of the earliest examples involved the human ABO blood group system, wherein the O allele is a null allele that produces no phenotype (ie is masked by the presence of the A or B alleles, which are codominant to each other). For the special ABO case, formulae have been developed for estimating the frequency of the O allele (Yasuda and Kimura, 1968) as well as for calculating the average paternity exclusion probability (Weir, 1996). In general, however, more emphasis has been placed on finding codominant markers than on improving statistical methods for dealing with null alleles.
By definition, a microsatellite null allele is any allele at a microsatellite locus that consistently fails to amplify to detected levels via the polymerase chain reaction (PCR). Despite the frequent invocation of null alleles to explain unexpected genotypic patterns in microsatellite data sets, little has been reported regarding their impact on statistical parameters used to draw biological inferences. Here we review scientific articles that describe methods to detect null alleles, uncover their molecular bases, estimate their frequency (p), and accommodate their effects in population genetic analyses. We also address likely consequences of null alleles in one of the primary conventional applications of microsatellite data: genetic parentage analysis.
Background and literature review
Potential causes of null alleles
Microsatellite markers are detected following PCR amplifications that employ locus-specific primers flanking the di-, tri-, or tetranucleotide repeat motifs that usually characterize each microsatellite region. Each primer has sequence complementary to a specific reference sequence in a genomic library constructed from one or more source specimens. Other alleles in the same species, and certainly those from different species, may differ to varying degrees from the reference sequence, and thus be less amenable to amplification using the original PCR primers (Primmer et al, 1995; Jarne and Lagoda, 1996). Thus, one potential cause of microsatellite null alleles is poor primer annealing due to nucleotide sequence divergence (eg involving point mutations or indels) in one or both flanking primers. In particular, key mutations in the 3′ end of the priming site, where extension begins, are thought to be especially detrimental to PCR amplifications (Kwok et al, 1990).
Null alleles can also be generated via differential amplification of size-variant alleles (Wattier et al, 1998). Due to the competitive nature of PCR, alleles of short length often amplify more efficiently than larger ones, such that only the smaller of two alleles might be detected from a heterozygous individual. Null alleles caused by differential amplification are sometimes termed ‘partial nulls’ because they can often be made visible by loading more sample or by adjusting contrast.
A third source of null alleles involves PCR failure due to inconsistent DNA template quality or low template quantity. These problems are insidious because in some cases only one or a few loci (or alleles) fail to amplify, whereas others amplify with relative ease from the same DNA preparation (Gagneux et al, 1997; Garcia de Leon et al, 1998). When DNA template at a locus is poor in some specimens but not others, the poor samples may appear ‘homozygous’ rather than heterozygous for the null allele.
Apart from these primary causes of ‘bona fide’ null alleles, several population genetic phenomena might give the false impression that microsatellite null alleles are present in a given study. Biological factors such as Wahlund effect or inbreeding, for example, can cause significant heterozygote deficits relative to Hardy–Weinberg equilibrium (HWE) that might be misconstrued as evidence for null alleles (Chakraborty et al, 1992). However, proper multilocus analyses can normally distinguish these causes because such population genetic factors should register more or less concordantly across loci, whereas the effects of null alleles are locus-specific.
Another potential source of spurious evidence for null alleles involves sex linkage, wherein in diploid organisms the heterogametic sex carries only one allele at any locus housed on a sex chromosome. Thus, if sex linkage goes unrecognized at a locus, an associated locus-specific ‘heterozygote deficit’ might be misconstrued as indicative of null alleles. Relatively few examples of sex-linked microsatellite loci have been published, and careful gender-specific analyses can identify their true nature (eg, Avise et al, 2004), but sex linkage remains a noneliminated source of potential error in most literature reports of ‘null alleles’ from published evidence.
Literature survey
All articles from Molecular Ecology (and Molecular Ecology Notes) were screened for mentions of microsatellite null alleles, and additional journals were computer-searched for articles that included ‘microsatellite’ or ‘null allele’ in the title or as keywords. Each identified paper was analyzed to determine the following: how microsatellite null alleles were inferred; whether PCR primers were redesigned for these loci; whether null allele frequencies were estimated (and if so, by what method); whether sequencing was used to uncover the molecular basis of a null allele; and whether loci with null alleles were retained or discarded in data analyses.
We identified 233 articles (list available from EED upon request) that purportedly encountered microsatellite null alleles. These articles included short primer discovery notes, microsatellite loci used in parentage studies, and those used to determine population structure or for other applications. Of the full-length articles, approximately one-third dealt with parentage issues, while the remainder was primarily concerned with population structure. Although we focus here on the effects of null alleles in parentage studies, it is possible that they may cause less bias in the analysis of population structure.
Where reported, the frequencies (p) of null alleles were almost always p<0.40, and usually <0.20 (Figure 1). (Of course, a strong reporting bias exists against loci with high null allele frequencies; in the extreme, a locus with p=1.0 would remain unrecognized, by definition.) The allele frequency tally in Figure 1 is based on only 74 microsatellite loci, because the authors of about 80% of the papers examined made no attempt to estimate p. About 90% of all studies nonetheless included loci with null alleles in their analyses, and only a small fraction of those incorporated statistical corrections to accommodate possible null allele effects.

Histogram of suspected null allele frequencies as recorded in the literature. Where a range or confidence interval of null allele frequencies at a locus was reported, the midpoint of that range was used in this analysis.
The possible presence of microsatellite null alleles was inferred by a variety of methods (Figure 2). The most common approach, used alone in about 70% of the reports, rested on the observation of a heterozygote deficit in the focal population, the rationale being that individuals heterozygous for a null allele and a visible allele would have been scored as homozygous for the visible allele (Callen et al, 1993). Many researchers used packages such as GenePop (Raymond and Rousset, 1995) or Cervus (Marshall et al, 1998) to check for HWE deviations and calculate expected null allele frequencies (computational methods detailed below). However, population substructure, inbreeding, or selection at or near a microsatellite locus could cause HWE departures as well.

Breakdown of how putative null alleles were identified in the current literature review (see text).
A perhaps more secure line of evidence for null alleles came in some of the studies involving genetic parentage analyses of family groups. In several such cases (eg Paetkau and Strobeck, 1995; Primmer et al, 1995; McCoy et al, 2001; Walker et al, 2002), a known or strongly suspected parent (from other genetic evidence) who appeared to be homozygous at a particular microsatellite locus was documented to produce progeny with a different ‘homozygous’ genotype. This outcome was interpreted as consistent with the possibility that both parent and offspring were heterozygous for a null allele at the locus in question. In other articles surveyed, additional grounds for inferring null alleles included simple reports of nonamplification, and various combinations of two or more lines of evidence (Figure 2).
In about 10% of the published articles, PCR primers suspected of producing null alleles were redesigned in attempts to recover normal inheritance at the locus in question. Finally, in a small number of studies, null alleles were sequenced to assess their detailed molecular basis (see beyond).
Frequency estimation methods
Various methods were used in different papers to estimate the frequencies of null alleles. A simple approach (although clearly of limited utility) was to estimate a null allele frequency (p) as the square root of the frequency of individuals whose DNA at the focal microsatellite locus failed to amplify (ie, presumed homozygotes for the null allele). Another intuitive method was to base p on a count of the number of null alleles as inferred from parentage analyses when (as mentioned above) a known parent and its offspring show different ‘homozygous’ genotypes at the focal locus only. Assuming that the null allele in a sample of N diploid individuals is rather rare, its frequency can then be estimated as the number of inferred null heterozygotes divided by 2N.
Two other popular methods for estimating null allele frequencies made use of the relationship between null allele presence and heterozygote deficit in a local population. Chakraborty et al (1992) first noted that nondetectable (null) alleles in RFLP analyses could in principle explain some observed heterozygote deficiencies, and they developed a formula for null allele frequency in terms of observed and expected heterozygosities (HO and HE). One assumption of this method is that nonamplifying individuals are not included, as they may be due to technical factors such as DNA degradation rather than null allele homozygotes. A modification of this method by Brookfield (1996) takes into account the potential presence of null homozygotes, and this was the approach most often employed in the articles reviewed above that included estimates of p.
Other methods of null allele frequency estimation were implemented in computer programs that utilize population genetic data. Many papers in the literature we surveyed employed either Genepop, which uses an iterative EM (expectation and maximization) approach to find the maximum likelihood estimate of null allele frequency (Dempster et al, 1977; Weir, 1996), or CERVUS, which uses a different iterative likelihood approach (Summers and Amos, 1997; Marshall et al, 1998) in which the presence of null allele homozygotes is not taken into consideration initially but is added in later optimization rounds. (This latter method avoids overestimating the frequency of a null allele if samples fail to amplify for reasons other than the presence of nulls.)
Sequencing of null alleles
All statistical methods described above are indirect approaches to the detection and characterization of microsatellite null alleles. To deduce the presence and basis of null alleles more directly, molecular approaches are required. In seven of the 233 articles surveyed in this review (3%), nucleotide sequences flanking the microsatellite region were determined in individuals suspected of carrying a null allele. In one of the earliest such papers, Callen et al (1993) described null alleles in human pedigrees. By sequencing PCR products obtained using redesigned primers, the authors showed that an 8-bp deletion was responsible for the original null (Callen et al, 1993). In another early article, Paetkau and Strobeck (1995) described a G to C transversion, located at the 3′ end of a primer site, which explained non-Mendelian patterns of inheritance at one locus in their parentage analysis of bears. A similar DNA sequencing analysis by Jones et al (1998) found that a suspected null allele in the White Sands desert pupfish was in fact a group of five alleles that differed from visible alleles by a 4-bp deletion in one of the primer regions, as well as by a single base substitution immediately flanking the microsatellite repeats.
Lehmann et al (1996) also found ‘null series’ in which multiple size classes were contained within an apparent null allele. In this case, PCR failure was due to an A to G change in the primer site. After primers were redesigned, alleles were successfully amplified from all individuals originally categorized as null homozygotes. Another case in which the molecular basis of a purported microsatellite allele was deduced by sequencing was prompted by the observation of a significant deficit of heterozygotes in oystercatcher birds. By screening the genomic library from which the locus was developed, Van Treuren (1998) identified two clones that differed only in a G to T transversion in the microsatellite flanking region.
Effects on parentage assessment
Average exclusion probability in computer-simulated data sets
One of the primary uses of microsatellite data is in genetic analyses of parentage (biological maternity and paternity), and one key consideration in such analyses is the average exclusion probability, which is a joint function of variability in the markers employed and the biological nature of the particular parentage problem. Exclusion probabilities are calculated in several different ways depending on biological setting, but the general idea is that they describe the power of a locus to genetically exclude candidate individuals as parents. One oft-employed estimate of exclusion probability, described by Jamieson and Taylor (1997, Equation 1a), is appropriate for parentage cases in which either the dam or the sire is known from secure independent evidence (such as pregnancy, or physical association with offspring), and the other parent is unknown prior to the molecular marker investigation. This method of calculating the average exclusion probability was used in many of the microsatellite-based articles reviewed above (despite the fact that one of the assumptions made is that there are no null alleles at the locus in question). This is also the statistic we employ below in computer programs that we have designed to explore whether null alleles at realistic frequencies might introduce significant bias into this conventional mean estimate of parental exclusion probability.
In our simulations, populations of varying numbers of diploid individuals (N=10, 50, or 100) were randomly assigned genotypes based on several distinct allele frequency distributions (see below). In each case, a ‘true’ exclusion probability (Jamieson and Taylor, 1997, Equation 1a) was calculated first from the entered allele frequencies (population frequencies). Next, the average of 1000 replications was used to get the ‘estimated without null’ exclusion probability. In each replication, the N individuals were assigned genotypes based on the entered allele frequencies, the allele frequencies in this sample were calculated, and the exclusion probability was calculated using these allele frequencies, assuming that every allele was visible. Finally, an ‘estimated with null’ exclusion probability was calculated as above, but under the assumption that one of the alleles from the population was really a null. Individuals that showed no visible alleles were not included in the calculation of allele frequencies and individuals showing only one visible allele were assumed to be homozygotes. These three calculations enabled us to differentiate between effects due to null alleles and effects due to sample size.
Two types of allele frequency distributions were tested in these simulations. In the first series, each of 9, 24, 49, or 99 alleles was assigned an equal frequency, with an additional simulated null allele ranging in frequency from p=0.00 to 0.98. The second series of simulations introduced allele-frequency skew by assigning a common allele at frequency p=0.60, followed by eight alleles of equal frequency and a null allele ranging from p=0.00 to 0.40.
Representative results from these simulations are presented in Figures 3 and 4 (additional graphs are available from EED upon request, but all are similar in form). Figure 3 shows the outcome when a possible 100 equally frequent alleles were assigned to a sample of 10 individuals. When the null allele was at or near zero frequency, the ‘estimated with null’ exclusion probability (calculated assuming that the highest numbered allele was a null) was equal to or slightly lower than the ‘true’ exclusion probability (calculated using the population allele frequencies entered), and was almost identical to the ‘estimated without null’ exclusion probability (calculated from the sample data, but assuming that all alleles were visible). In this low-frequency region for the null allele, a consistent effect of small sample size was seen as a deviation between the ‘true’ and ‘estimated without null’ exclusion probabilities, but the magnitudes of the difference were quite small and in the direction of producing an underestimate (rather than an overestimate) of the true exclusion probability. When larger sample sizes (N= 50, 100) were used (data not shown), there was almost no distinction between ‘true’ and ‘estimated without null’ values, but these values were still greater than or equal to ‘estimated with null’ for small values of p. However, as the frequency of the null allele increased, ‘estimated with null’ exclusion probabilities often diverged increasingly from both the ‘true’ and ‘estimated without null’ exclusion values, sometimes exceeding them dramatically. This result may be due to the fact that at high null allele frequencies, a large number of individuals are null homozygotes, and thus are discarded from the estimation of allele frequencies in the ‘estimated with null’ exclusion probability calculations. Accordingly, the estimated frequency of each visible allele is inflated, leading to an ‘estimated with null’ exclusion probability that is much greater than if the very common null allele was considered.

Example of computer simulation results in which all alleles were equitable in frequency. See text for explanations of ‘true’, ‘estimated without null’, and ‘estimated with null’ exclusion probabilities (EP). Note that null alleles are disregarded in the ‘true’ and ‘estimated without null’ exclusion probabilities, so the ‘null allele frequency’ label on the Y-axis refers strictly to the ‘estimated with null’ EP. In simulations where 50 or 100 individuals were sampled, the lines corresponding to ‘true’ and ‘estimated without null’ exclusion probabilities were exactly coincident (data not shown).

Example of results of simulations in which allele frequencies were skewed. See legend to Figure 3, and text for further explanation.
By contrast, in simulations that employed skewed allele frequencies (example in Figure 4), the ‘estimated with null’ exclusion probabilities normally remained below both the ‘true’ and ‘estimated without null’ values throughout the monitored range of null allele frequencies. This is because null alleles in the simulated population are more likely to be found in the heterozygous state in association with the common allele than with the other visible alleles, which are present at very low frequencies. Thus, the frequency of the common allele is inflated more than the other visible alleles, leading to a reduced exclusion probability.
Results from our simulations suggest that under most realistic situations, that is, when microsatellite null alleles are uncommon to rare (p<0.2), their presence causes a slight underestimate of the average exclusion probability at a locus, but probably not of sufficient magnitude to warrant great concern. Also, by underestimating the exclusion probability, a researcher's confidence in that marker is reduced, making this sort of estimation error far preferable to one in which this probability is overestimated and the researcher is thereby given false confidence of higher exclusionary power. However, when the frequency of a null allele is >0.2, mean ‘estimated with null’ exclusion probabilities can be much higher than the ‘true’ and ‘estimated without null’ values. For this reason (as well as others described below), the marker locus probably should simply be dropped from the parentage analysis.
Another conclusion from our simulations is the relatively minor influence of sample size on the estimation of mean exclusion probabilities. When N=10, for example, the ‘true’ exclusion probabilities calculated from the entered population frequencies deviated little from the ‘estimated without null’ exclusion probabilities calculated from allele frequencies observed in small samples from that population. When sample sizes were increased to N=50 or 100, the differences between these two exclusion probabilities shrank even further.
In conclusion, we find at least four reasons as to why null alleles are unlikely to have much impact on average exclusion probabilities in most parentage studies. First, in most cases from the literature, reported frequencies of null alleles were in the uncommon to rare range where their effects on average exclusion probabilities are demonstrably low. Second, within this low-frequency zone, most errors that null alleles introduce in exclusion probability estimates are likely to be in the direction of cautioning rather than emboldening researchers in their use of these marker loci. Third, nearly all parentage analyses are based on several microsatellite loci, for which the combined exclusion probability is calculated as a function of the product of single locus exclusion probabilities (Boyd, 1954). This multiplicative effect means that, even in the worst-case scenario in which every locus has nulls, the net result is a magnified underestimate (rather than overestimate) of mean exclusion probabilities calculated from the data. Finally, microsatellite loci with common null alleles would also have high expected frequencies of homozygotes, thus further making them unappealing for parentage studies (regardless of explicit considerations of average exclusion probabilities per se).
False exclusion of true parents
Possible complications of null alleles in parentage analysis could arise in a somewhat different way, however: via their potential to falsely exclude a true parent when an offspring in question is heterozygous for a null allele. As mentioned above, an apparent ‘homozygous’ offspring could actually be the progeny of an adult displaying a different ‘homozygous’ phenotype, if in fact both were actually heterozygotes for a null allele that the offspring had inherited from that parent. In such cases, excluding the true parent could be a consequential problem even when null allele frequencies are low.
In general, if there are k−1 visible alleles with population frequencies pi (i=1 to k−1), plus a null allele with frequency pk, then the probability of false exclusion of a true parent is
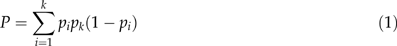
This equation is derived by assuming that a null heterozygous parent (AiAk) may give to an offspring its null allele (Ak), and that the other parent gives to that offspring any visible allele other than Ai. It is the summation over all possible heterozygous nulls, and also incorporates the probability that one parent may be a homozygous null and that the other transmits any visible allele (in which case a true parent could again be falsely excluded). When all allele frequencies (including the null) are equal, Equation (1) simplifies to

Using Equation (1), as applied to similar allele-frequency conditions to those reported above in the computer simulations, we calculated the probabilities of falsely excluding an actual parent. As shown in Figure 5, these probabilities are often substantial (up to about 25%). Indeed, they are as high as about 15% even when the null allele is present in a frequency (p≅0.2) at and below which the average exclusion probability was not appreciably influenced (as described above). Even greater rates of false exclusion are encountered when null alleles are present at multiple loci. For example, at a locus with 100 alleles, a null allele with 10% frequency would cause a 9.8% rate of false exclusion. Two such loci would result in 18.7% false exclusions, and five loci considered together would have a troubling 40.4% rate of false exclusions.

Probability of falsely excluding an actual parent of an offspring that is heterozygous for a null allele. As in the simulations, frequencies of the null allele were incrementally increased while those of the remaining alleles were kept equal.
Thus, although average exclusion probabilities are normally impacted only minimally by the presence of null alleles, parentage analyses nonetheless can be significantly compromised when null alleles produce false parentage exclusions in particular families. Mismatches between putative parents and offspring were reported in a number of articles reviewed above (see for examples, Paetkau and Strobeck, 1995; Dow and Ashley, 1996; Banks et al, 1999). In some cases, primers were redesigned to eliminate null alleles, but in others, the null-producing loci were retained, with alternative methods used to compensate. False conclusions due to null alleles in parentage assignment can be minimized by requiring that exclusions be based on mismatches at more than one locus, or by never interpreting homozygotes for different alleles as necessarily being incompatible with the individuals in question being parent–offspring pairs.
Conclusions
In the 233 articles surveyed in this review, a host of different methods to deal with microsatellite null alleles was uncovered. By far the most common approach was simply to report a supposed detection of null alleles by indirect or (rarely) direct documentation criteria and then take no further corrective action with regard to population applications. In principle, the mechanistic basis of suspected null alleles can be characterized by sequencing microsatellite flanking regions in each specimen suspected of carrying a null allele, but only a few (albeit highly informative) empirical studies of this sort have been conducted to date. In terms of average exclusion probabilities, our computer simulations indicate that microsatellite null alleles at frequencies typically reported in the literature are unlikely to introduce serious biases into genetic parentage assessments. However, microsatellite null alleles can cause egregious errors when they lead to false exclusions of paternity or maternity in particular families. This problem can be ameliorated by adopting strategies that consider the potential presence of null alleles.
References
Avise JC, Power AJ, Walker D (2004). Genetic sex determination, gender identification, and pseudohermaphroditism in the knobbed whelk, Busycon carica (Mollusca; Melongenidae). Proc R Soc Lond B 271: 641–646.
Banks MA, Blouin MS, Baldwin BA, Rashbrook VK, Fitzgerald HA, Blankenship SM et al (1999). Isolation and inheritance of novel microsatellites in Chinook Salmon (Oncorhynchus tschawytscha). J Hered 90: 281–288.
Boyd WC (1954). Tables and monograms for calculating chances of excluding paternity. Am J Hum Genet 6: 426–433.
Brookfield JFY (1996). A simple new method for estimating null allele frequency from heterozygote deficiency. Mol Ecol 5: 453–455.
Callen DF, Thompson AD, Shen Y, Phillips HA, Richards RI, Mulley JC et al (1993). Incidence and origin of ‘null’ alleles in the (AC)n microsatellite markers. Am J Hum Genet 52: 922–927.
Chakraborty R, De Andrade M, Daiger SP, Budowle B (1992). Apparent heterozygote deficiencies observed in DNA typing data and their implications in forensic applications. Ann Hum Genet 56: 45–57.
Dempster AP, Laird NM, Rubin DB (1977). Maximum likelihood from incomplete data via the EM algorithm. J R Stat Soc B 39: 1–38.
Dow BD, Ashley MV (1996). Microsatellite analysis of seed dispersal and parentage in bur oak, Quercus macrocarpa. Mol Ecol 5: 615–627.
Gagneux P, Boesch C, Woodruff DS (1997). Microsatellite scoring errors associated with noninvasive genotyping based on nuclear DNA amplified from shed hair. Mol Ecol 6: 861–868.
Garcia de Leon FJ, Canonne M, Quillet E, Bonhomme F, Chatain B (1998). The application of microsatellite markers to breeding programmes in the sea bass, Dicentrarchus labrax. Aquaculture 159: 303–316.
Jamieson A, Taylor St CS (1997). Comparisons of three probability formulae for parentage exclusion. Anim Genet 28: 397–400.
Jarne P, Lagoda PJL (1996). Microsatellites, from molecules to populations and back. Trends Ecol Evol 11: 424–429.
Jones AG, Stockwell CA, Walker D, Avise JC (1998). The molecular basis of a microsatellite null allele in the White Sands pupfish. J Hered 89: 339–342.
Kwok S, Kellog DE, McKinney N, Spasic D, Goda L, Levenson C et al (1990). Effects of primer-template mismatches on the polymerase chain reaction: human immunodeficiency virus 1 model studies. Nucleic Acids Res 18: 999–1005.
Lehmann T, Hawley WA, Collins FH (1996). An evaluation of evolutionary constraints on microsatellite loci using null alleles. Genetics 144: 1155–1163.
Marshall TC, Slate J, Kruuk LEB, Pemberton JM (1998). Statistical confidence for likelihood-based paternity inference in natural populations. Mol Ecol 7: 639–655.
McCoy EE, Jones AG, Avise JC (2001). The genetic mating system and tests for cuckoldry in a pipefish species in which males fertilize eggs and brood offspring externally. Mol Ecol 10: 1793–1800.
Paetkau D, Strobeck C (1995). The molecular basis and evolutionary history of a microsatellite null allele in bears. Mol Ecol 4: 519–520.
Primmer CR, Moller AP, Ellegren H (1995). Resolving genetic relationships with microsatellite markers: a parentage testing system for the swallow Hirundo rustica. Mol Ecol 4: 493–498.
Raymond M, Rousset F (1995). GenePop (Ver. 1.2): a population genetics software for exact test and ecumenicism. J Hered 86: 248–249.
Summers K, Amos W (1997). Behavioral, ecological, and molecular genetic analyses of reproductive strategies in the Amazonian dart-poison frog, Dendrobates ventrimaculatus. Behav Ecol 8: 260–267.
Van Treuren R (1998). Estimating null allele frequencies at a microsatellite locus in the oystercatcher (Haematopus ostralegus). Mol Ecol 7: 1413–1417.
Walker D, Porter BA, Avise JC (2002). Genetic parentage assessment in the crayfish Orconectes placidus, a high-fecundity invertebrate with extended maternal brood care. Mol Ecol 11: 2115–2122.
Wattier R, Engel CR, Saumitou-Laprade P, Valero M (1998). Short allele dominance as a source of heterozygote deficiency at microsatellite loci: experimental evidence at the dinucleotide locus Gv1CT in Gracilaria gracilis (Rhodophyta). Mol Ecol 7: 1569–1573.
Weir BS (1996). Genetic Data Analysis II., Sinauer: Sunderland, MA.
Yasuda N, Kimura M (1968). A gene-counting method of maximum likelihood for estimating gene frequencies in ABO and ABO-like systems. Ann Hum Genet 31: 409–420.
Acknowledgements
This manuscript was greatly improved by comments from P Smouse and several anonymous reviewers, who among other things alerted us to the problem of false parentage exclusions as illustrated by the approach in Equations (1) and (2). This work was supported by University of Georgia funds and a Pew Fellowship to JCA.
Author information
Authors and Affiliations
Corresponding author
Rights and permissions
About this article
Cite this article
Dakin, E., Avise, J. Microsatellite null alleles in parentage analysis. Heredity 93, 504–509 (2004). https://doi.org/10.1038/sj.hdy.6800545
Received:
Accepted:
Published:
Issue Date:
DOI: https://doi.org/10.1038/sj.hdy.6800545
Keywords
This article is cited by
-
Genetic diversity and population structure of wild and cultivated apricots collected from Kyrgyzstan
Genetic Resources and Crop Evolution (2024)
-
Population structure of endangered spinetail devil ray (Mobula mobular) in the Lesser Sunda Seascape, Indonesia, revealed using microsatellite and mitochondrial DNA
Aquatic Sciences (2024)
-
Genetic diversity of Aedes aegypti and Aedes albopictus from cohabiting fields in Hainan Island and the Leizhou Peninsula, China
Parasites & Vectors (2023)
-
Assessing population structure and migration patterns of wild boar (Sus scrofa) in Japan
Scientific Reports (2023)
-
Genetic footprints of a rapid and large-scale range expansion: the case of cyclic common vole in Spain
Heredity (2023)
