Abstract
Gene expression analysis was performed on a human renal cancer cell line (786-0) with mutated VHL gene and a transfectant with wild-type VHL to analyse genes regulated by VHL and to compare with the gene programme regulated by hypoxia. There was a highly significant concordance of the global gene response to hypoxia and genes suppressed by VHL. Cyclin D1 was the most highly inducible transcript and 14-3-3 epsilon was downregulated. There were some genes regulated by VHL but not hypoxia in the renal cell line, suggesting a VHL role independent of hypoxia. However in nonrenal cell lines they were hypoxia regulated. These included several new pathways regulated by hypoxia, including RNase 6PL, collagen type 1 alpha 1, integrin alpha 5, ferritin light polypeptide, JM4 protein, transgelin and L1 cell adhesion molecule. These were not found in a recent SAGE analysis of the same cell line. Hypoxia induced downregulation of Cyclin D1 in nonrenal cells via an HIF independent pathway. The selective regulation of Cyclin D1 by hypoxia in renal cells may therefore contribute to the tissue selectivity of VHL mutation.
Main
Germline mutations in the von Hippel-Lindau (VHL) tumour suppressor gene are associated with a dominantly inherited renal cancer syndrome (Latif et al, 1993; Chen et al, 1995) and sporadic renal cancer. The VHL gene product pVHL is a critical component of a multiprotein ubiquitin ligase complex that targets the regulatory HIF-α subunits of hypoxia-inducible factor 1 (HIF-1) for oxygen-dependent proteolysis (Iwai et al, 1999; Maxwell et al, 1999; Cockman et al, 2000; Ivan et al, 2001). HIF-1 is expressed in response to hypoxia in most cell types and activates the transcription of genes involved in a variety of physiological and cellular processes including vascular endothelial growth factor (VEGF), glucose transport (glucose transporters), glycolysis (glycolytic enzymes), and cell survival (insulin-like growth factor 2) (Semenza, 1999). pVHL defective cells, both in cell culture and in the context of human tumours, constitutively overexpress HIF-1 target genes irrespective of their environmental oxygen concentration (Iliopoulos et al, 1996), due to the constitutive stabilisation of HIF-alpha subunits (Maxwell et al, 1999).
While a clear role of HIF-1 in producing vascularisation of tumours has emerged, the role of HIF activation in oncogenesis is still poorly defined. In particular, the mechanisms for tissue specificity of the effects of VHL mutation are unknown. Recently, we and others have identified a number of new pVHL target genes and demonstrated that many of these were hypoxia-responsive in wild-type pVHL cell lines (Koong et al, 2000; Wykoff et al, 2000; Lal et al, 2001). Whether there are other hypoxia non-VHL regulated pathways in renal cell lines is unknown.
Therefore in the current study, we have analysed a pair of renal cell carcinoma transfectants that are either defective or competent for pVHL to mRNA expression profiling. We have examined not only the pattern of gene expression affected by pVHL status but also that affected by hypoxia in both the absence and presence of a functional VHL gene product The analysis shows that there was a strong relation between genes regulated by hypoxia and those regulated by VHL. There were no genes regulated by hypoxia independently of VHL, but there were genes regulated by VHL that were not hypoxia regulated in the renal cell line used for the study. The unexpectedly high concordance prompted us to analyse hypoxia regulation of genes in the latter class in other cell types, and also genes from our previous study of VHL regulated genes in a different renal cell type (Wykoff et al, 2000), which were VHL but not hypoxia responsive. These genes were clearly regulated by hypoxia in other nonrenal cell types.
Cyclin D1 was identified as the most highly inducible gene in the array and in contrast to all other cell lines and studies reported, was upregulated by hypoxia not downregulated. Additionally, 14-3-3 epsilon was downregulated providing a combined modulation of G1 and G2 checkpoints. The tissue selectivity of VHL transformation in renal cancer may be related to the tissue-specific direction of regulation of this key checkpoint by hypoxia.
Materials and methods
Cell lines
786-0 cells expressing pVHL or empty vector were a gift from WG Kaelin. RCC lines were as described (Maxwell et al, 1999). RCC4/iVHL-HA (C1.2) and RCC4/iVA (VA1) are human renal cancer cell lines with mutant VHL, the former transfected with an HA tagged wild-type VHL, the latter the empty vector control. A549, EJ28, HBL-100, and ZR-75-1 lines were from ATCC. Embryonic stem cells with deleted HIF-1 alpha or HIF-2 alpha were generously provided by P Carmeliet. Cells were grown in DMEM (Sigma) supplemented with 10% foetal calf serum (Globepharm), L-glutamine (2 mM), penicillin (100 μg ml−1), and streptomycin sulphate (100 U ml−1). Studies of inducible gene expression were performed on cells approaching confluence. Hypoxic conditions were generated in a Napco 7001 incubator (Precision Scientific) with 0.1% O2, 5% CO2, and balance N2, for 16 h.
Preparation and hybridisation of fluorescent labelled cDNA
One round Eberwine's et al (1992) RNA amplification procedure with minor modifications was performed using polyA RNA from 786-0 RCC cancer cell line under different conditions. This methodology is similar to that employed by Affymetrix, Inc. for the production of probe in their chip microarray expression analysis.
The cDNA probes were prepared from antisense RNA. Briefly, we used 3 μg of antisense RNA for Cy3 and Cy5 labelling. After probe purification the two separated probes were combined, mixed with hybridisation solution, denatured, and hybridised onto a 6000-feature cDNA microarray in a humidified chamber at 65°C for 16 h. The slides were then rinsed by submersion and agitation for 2 min in 2 × SSC with 0.1% SDS, followed by 1 × SCC, 0.2 × SCC, and 0.05 × SCC and then dried.
Scanning and data processing
Following hybridisation, microarrays were scanned using a 10 μm resolution GenePix 4000 scanner (Axon Instruments, Inc., Foster City, CA, USA) at variable PMT (photo-multiplier tube) voltage to obtain maximal signal intensity with <1% probe saturation. Resulting TIFF images for each fluorescent were analysed with GenePix software version 3.0 (Axon Instruments, Inc., Foster City, CA, USA). The data files generated by GenePix v3.0 were entered into a web-based database maintained by the Bioinformatics and Molecular Analysis Section of the CIT (Center for Information Technology), National Cancer Institute, Bethesda, MD, USA.
To study the gene expression profiles, an average linkage hierarchical cluster analysis utilising a correlation metric of similarity for clustering genes was performed as described by Eisen et al (1998). A metric multidimensional scaling for analysing and visualising the correlation among expression profiles of samples was also performed (Tenenbaum et al, 2000). To exclude labelling biases, antisense RNA-based targets from either cell line were labelled with the reciprocal fluorochrome in every other duplicate experiment. Differentially expressed genes were designated significant if they were reproducibly induced by >2-fold in three out of four experiments for each screening.
Ribonuclease protection assay (RPA)
Total RNA was extracted by a modified acid/guanidinium thiocyanate/phenol/chloroform method (RNAzol B, Cinna/Biotec Laboratories), and dissolved in hybridisation buffer (80% formamide, 40 mM PIPES, 400 mM sodium chloride, and 1 mM EDTA, pH 8). For details of riboprobe templates employed to examine the expression of previously described VHL-responsive genes, see Wykoff et al (2000). Quantification of the protected species from 30 μg was performed using a phosphoimager (Molecular Dynamics), and related to an internal control assay for the constitutively expressed U6 small nuclear RNA (LC), performed for each assay as described (Maxwell et al, 1999).
Cell lysis and immunoblotting
Whole-cell protein extracts were prepared from tumours by section of frozen tissue and 30 s homogenisation in denaturing conditions as described (Wiesener et al, 1998). For Immunoblot analysis, aliquots were separated by SDS–polyacrylamide gel electrophoresis and transferred onto Immobilon-P membranes. Cyclin D1 was detected using the mouse monoclonal anti-human cyclin D1 mouse monoclonal Ab MCA1756 (Serotec, UK) (1 : 1000) at 4°C for 16 h. HRP-conjugated goat-anti-mouse immunoglobulin (DAKO) (1 : 1000) was applied for 1 h at room temperature (RT). ECL Plus (Amersham Pharmacia) was used for visualisation.
Results
Comparison of VHL-responsive and hypoxia-responsive genes on gene array
Comparing VHL-deficient 786-0 cell line expressing vector backbone alone (786-0) or wild-type human VHL (786-0/VHL), 28 genes were repressed and 29 genes were induced by stable transfection of VHL (Table 1). As anticipated, some of the VHL-repressible genes were previously identified VHL-targets, including endothelin 1 (EDN1) and transforming growth factor alpha (TGFA). In 786-0/VHL, 11 genes were induced and nine genes were repressed by hypoxia (Table 2).
A striking concordance in the pattern of gene regulation across the entire screen was observed when the VHL-responsive genes were compared to the hypoxia-responsive genes in 786-0/VHL (Figure 1). VHL-repressible genes (represented with reds of various intensities in the left column) were typically hypoxia-inducible in 786-0/VHL (red in middle column). A similar response was seen with VHL-inducible genes, which were hypoxia repressible (represented with greens of various intensities in the left column).
Hierarchical cluster analysis of differentially expressed genes. Each row represents a single gene (identified by its abbreviation at the right. See Table 1, 2, or 3 for corresponding gene name). Each column represents the average of the four replicates for each experiment. VHL−/+, comparison of gene expression in 768-0 (−) vs 786-0/VHL (+) in normoxia; 786-0/VHL H/N, comparison of gene expression in hypoxia (H) vs normoxia (N) in 786-0/VHL; 786-0 H/N, comparison of gene expression in hypoxia (H) vs normoxia (N) in 786-0. Significantly regulated genes are represented by a block of a particular colour, which was determined by its sign and magnitude of regulation by the given stimulus; red blocks indicate overexpressed genes while green blocks indicate underexpressed genes. Black bars indicate genes with approximately equivalent expression levels and grey bars indicate missing data. Colour code at bottom correlates colour intensity with fold-regulation. Dendrogram at the left of the figure illustrates the relationship between the observed patterns of gene regulation, where the shorter the branch length between two gene, the more similar their pattern of regulation across the three comparisons.
In comparison to the changes in gene expression induced by changes in VHL-status and hypoxia in 786-0/VHL, strikingly few changes in gene expression were observed in 786-0 in response to hypoxia. Three genes were significantly induced by hypoxia in 786-0, two of which, TGFA and uridine diphosphoglucose pyrophosphorylase (UGP2), were also identified as hypoxia-inducible in 786-0/VHL. Array screening identified 10 genes that were repressed by hypoxia in 786-0 (Table 3)
RNase protection analysis of candidate VHL-responsive and hypoxia-responsive genes
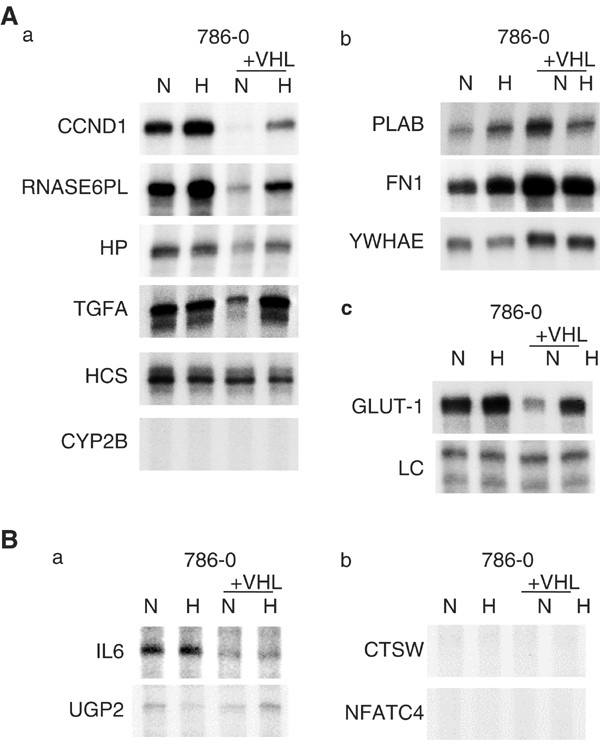
RNase protection assays (RPA) were used to validate the findings. Nine of the identified VHL-responsive genes predicted by array screening to be either downregulated (cyclin D1 (CCND1), ribonuclease 6 precursor (RNASE6PL), hypothetical protein DKFZp434K1210 (HP), TGFA, cytochrome c (HCS), and cytochrome P450 subfamily IIB polypeptide 6 (CYP2B)), or upregulated (prostate differentiation factor (PLAB), fibronectin (FN1), and 14-3-3 epsilon (YWHAE)) by reintroduction of VHL into 786-0 were examined by RPA (Figure 2A(a) and (b) respectively, comparing the paired cell lines in normoxia). Seven of these genes were clearly confirmed to be regulated as predicted by array screening, while one did not show regulation (HCS) and one was not expressed at detectable levels by RPA (CYP2B).
RPAs of array screening predicted VHL and hypoxia-responsive target genes. Cells were exposed to either normoxia (N; 20% O2) or hypoxia (H; 0.1% O2) for 16 h. Analysis of expression in 786-0 and the corresponding wt VHL stable tranfectant (+VHL) by RPA. See Table 1, 2 and 3 for corresponding gene names and a summary of the illustrated RPAs. (A) Genes predicted to be either downregulated (a) or upregulated (b) by wt VHL. (c) Expression of control genes: GLUT-1, a known hypoxia-inducible VHL target; LC, internal control assay (constitutively expressed U6 small nuclear RNA). All samples and assays (in A and B) were controlled in both ways. (B) Genes predicted to be either upregulated (a) or downregulated (b) by hypoxia in 786-0.
Five of these predicted VHL-responsive genes were also predicted by the array analysis to be regulated by hypoxia in 786-0/VHL. As illustrated in Figure 2A, each of these genes were confirmed to be either upregulated (CCND1, RNASE6PL, HP, TGFA) or downregulated (PLAB) by hypoxia in 786-0/VHL.
Therefore, each analysed gene predicted by array screening to be regulated both by VHL-status and by hypoxia in 786-0/VHL was confirmed by RPA, that is, the genes responsive to hypoxia were also regulated by VHL-status in 786-0/VHL.
VHL independent hypoxia response
To examine for the presence of VHL-independent hypoxia-mediated changes in gene expression, seven of the hypoxia-responsive genes predicted by array screening in 786-0 were examined by RPA as being either upregulated (TGFA, IL6, and UGP2) or down-regulated (HCS, CTSW, CYP2B, and NFATC4) by hypoxia (Figure 2B(a) and (b) respectively). This included all of the genes predicted to be significantly hypoxia-inducible in 786-0, and four of the top five differentially expressed genes predicted to be significantly downregulated by hypoxia in 786-0. While one of these genes, HCS, was slightly regulated as predicted by array screening, TGFA and IL6 were expressed but unregulated, UGP2 was too lowly expressed to make a definitive conclusion as to regulation, and CTSW, CYP2B, and NFATC4 were not expressed at detectable levels by RPA.
Therefore, while array screening for genes responsive to VHL-status and hypoxia in 786-0/VHL was generally reliable, the majority of genes predicted to be hypoxia-responsive in 786-0 were unable to be confirmed by RPA.
Further characterisation of cyclin D1 RNA and protein expression in renal carcinoma derived cell lines
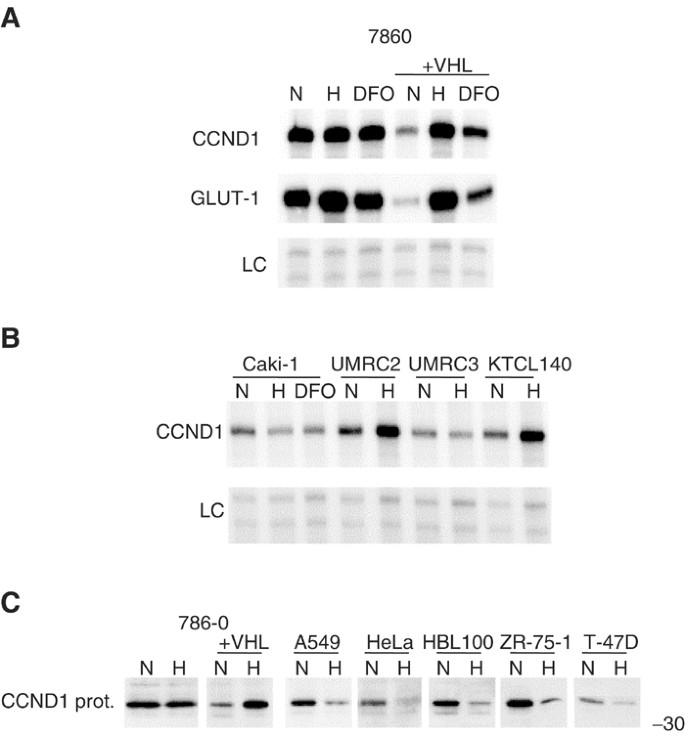
The expression of CCND1 was examined in three additional renal carcinoma cell lines, and its regulation by the iron chelator desferrioxamine (DFO) (Figure 3A). CCND1 RNA was not affected by either hypoxia or DFO in the functionally wt VHL cell line, Caki-1. It was not modified by hypoxia in the VHL-defective cell lines, UMRC2, UMRC3, and KTCL140 (Figure 3B). CCND1 protein was found to be regulated by VHL-status and hypoxia in the 786-0 background similarly to the regulation of its RNA (Figure 3C).
Further characterisation of the cyclin D1 response to hypoxia. Cells were exposed to either normoxia (N; 20% O2), hypoxia (H; 0.1% O2), or desferrioxamine (DFO; 100μ M) for 16 h. (A) RPAs of cyclin D1 (CCND1) and GLUT-1 in either 786-0 or 786-0/VHL exposed to either N, H, or DFO. (B) RPAs of CCND1 in Caki-1 (pVHL functionally wt), UMRC2, UMRC3, and KTCL140 (pVHL functionally deficient). LC, internal control assay (constitutively expressed U6 small nuclear RNA). (C) Western blots of whole-cell extracts using anti-human CCND1 monoclonal Ab MCA1756; CCND1 protein expression in kidney (786-0, 786-0/VHL), lung (A549), cervical (HeLa), and breast (HBL100, ZR-75-1, T-47D) derived cell lines. Numbers to the right of protein gels indicate approximate molecular weights (kDa) as determined by protein standards run on each gel.
CCND1 regulation by an inducible VHL in renal cancer cell line RCC4
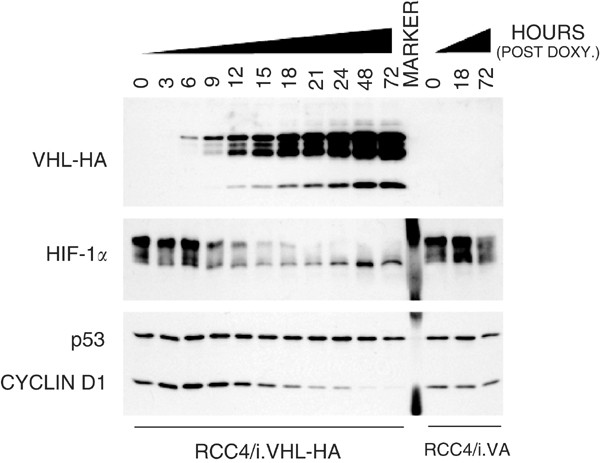
To better characterise CCND1 regulation, the effect of regulated pVHL expression upon CCND1 protein expression was examined in RCC4/iVHL-HA and RCC4/iVA cells the former comprising an inducible wild-type VHL in a VHL minus background, the latter the control. A 72 h time course of DOX treatment was employed to assess the relationship between pVHL induction and CCND1 expression (Figure 4). There was a time-dependent increase in pVHL-HA protein expression. The kinetics of pVHL-HA expression was rapid and over a large inducible range. HIF-1α protein expression highlighted an inverse relationship with pVHL expression (Figure 4, middle panel). In contrast to p53 expression, which was not affected by pVHL status, the expression of the CCND1 gene product was almost completely suppressed following pVHL-HA induction. Eliminating the possibility of nonspecific DOX-associated side effects, CCND1 expression was not modulated in control cells treated in parallel.
Time course of DOX-inducible pVHL-HA protein expression and effect upon downstream targets. Parallel cultures of RCC4/iVHL-HA (C1.2) and RCC4/iVA (VA1) were grown in the presence of DOX (0.5 μg ml−1) for up to 72 h. Whole-cell protein extracts were collected subconfluent populations of C1.2 and VA1 cells at 3-h intervals for the first 24 h, and daily thereafter. Whole-cell extracts (20 μg) were resolved by SDS–PAGE: VHL-HA (13.5%); HIF-1α (6%); and cyclin D1/p53 (10%) and immunoblotted with: anti-HA (rat mono); anti-HIF-1α (mAb clone 54); anti-cyclin D1 (pAb MCA1756); and anti-p53 (mAb DO-7). Equivalent loading was confirmed by Coomassie staining membrane after immunoblotting.
Analysis of cyclin D1 mRNA and protein expression in nonrenal cell lines
CCND1 protein has been reported to be downregulated by hypoxia in at least two cell lines: the pheochromocytoma derived PC12 cell line (Conrad et al, 1999) and the ovarian carcinoma SKA cell line (Krtolica et al, 1999). To assess the tissue specificity of responses cell lines derived from the lung (A549), bladder (EJ-28), breast (HBL100), or cervical (HeLa) tissue were used to analyse CCND1 regulation. CCND1 RNA was constitutively expressed and unresponsive to hypoxia in two cell lines (A549 and EJ-28), had very low level expression in HBL100 cells, and downregulated by hypoxia in HeLa cells (data not shown).
CCND1 protein was downregulated by hypoxia in all the nonrenal cell lines examined including cells derived from lung (A549), cervical (HeLa), or breast (HBL100, ZR-75-1,T-47D) cancers (Figure 3C).
Expression of cyclin D1 in HIFalpha mutant cells
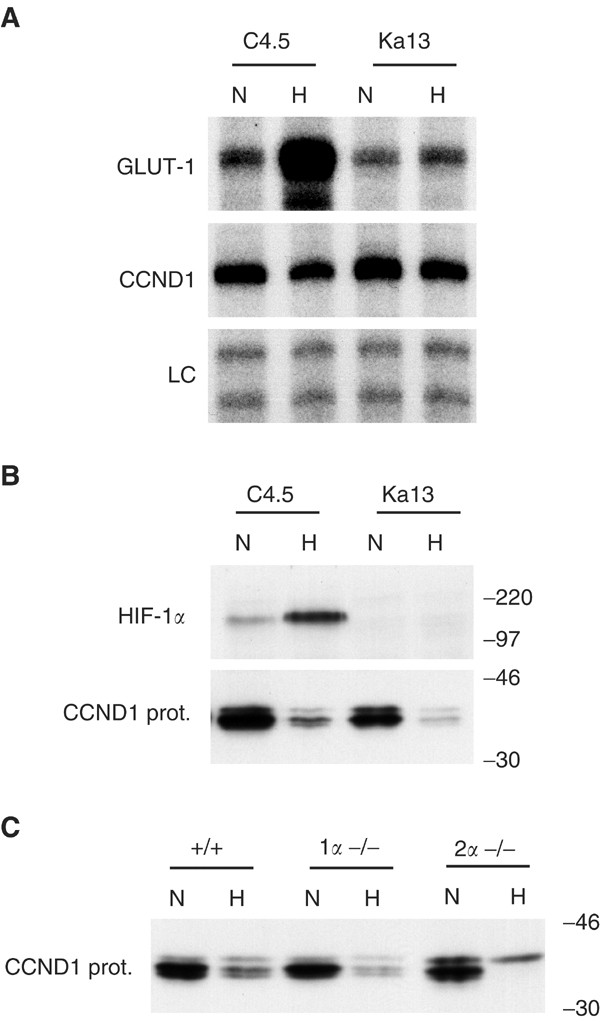
CCND1 response to hypoxia was examined in a wild-type Chinese hamster ovary cell line (C4.5) and a mutant derivative that is functionally defective in HIF-1 alpha (Ka13) (Wood et al, 1998). While CCND1 RNA was slightly downregulated by hypoxia in both C4.5 and Ka13 (Figure 5A), its protein showed a more significant downregulation by hypoxia, which was HIF alpha-independent (Figure 5B). CCND1 protein response to hypoxia was examined in wt, HIF-1 alpha knockout (−/−), and HIF-2 alpha −/− ES. As illustrated in Figure 5C, CCND1 protein was downregulated by hypoxia independent of HIF-1 alpha or HIF-2 alpha in this background.
Response of cyclin D1 to hypoxia is HIF-1α and HIF-2α independent in non-RCC cells. Cells were exposed to either normoxia (N; 20% O2) or hypoxia (H in non-RCC cells; 0.1% O2) for 16 h unless otherwise stated. (A and B) Examination of wild-type CHO cells (C4.5) and HIF-1α deficient CHO cells (Ka13). (A) RPAs of GLUT-1 and cyclin D1 (CCND1). LC, internal control assay (constitutively expressed U6 small nuclear RNA). (B and C) Western blots of whole-cell extracts using either anti-human HIF-1α mouse monoclonal Ab NB 100-105 or anti-human CCND1 monoclonal Ab MCA1756. (B) HIF-1α and CCND1 protein expression. (C) Induction of CCND1 protein by hypoxia (1% O2, 16 h) in mouse wt (+/+), HIF-1α knockout (1α−/−) and HIF-2α knockout (2α−/−) embryonic stem cells. Numbers to the right of protein gels indicate approximate molecular weights (kDa) as determined by protein standards run on each gel.
Expression of cyclin D1 in human renal cell carcinomas
CCND1 protein expression was examined in protein extracts from a panel of renal cell carcinomas (RCCs) (T) of either the clear cell (CC-RCC) or papillary type and compared to CCND1 protein expression in adjacent macroscopically normal tissue (N) from the same patient. In contrast to the four papillary tumours, nine of 10 CC-RCCs expressed markedly elevated levels of CCND1 protein (data not shown).
Regulation of other genes by VHL but not hypoxia
There were more genes regulated by VHL re-expression than regulated by hypoxia in the array. As the experiment with inducible VHL showed a wide range of expression with time and a similar reciprocal regulation of CCND1, it is possible that a transfectant with a set high level of VHL could be sufficient to continue to repress some genes in hypoxia. The nonrenal cell lines were therefore analysed for hypoxic regulation of genes that showed weak regulation in the transfectant. FN1 was hypoxia-inducible in both (A549, HBL100) nonrenal cell lines in which its RNA was detected.
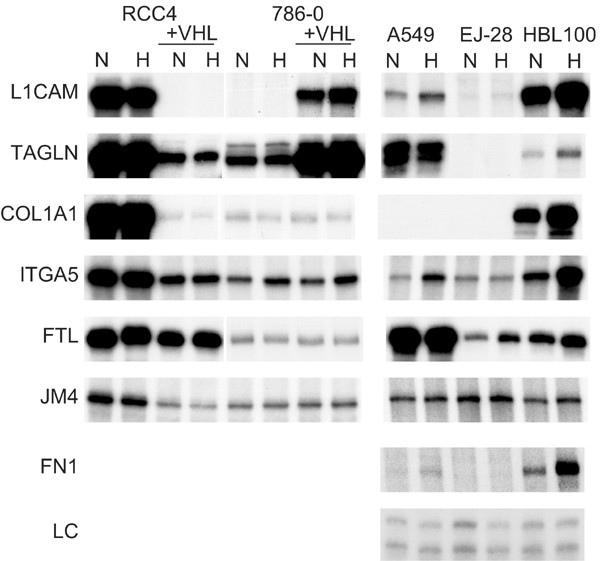
Of importance in interpreting these results, a similar phenomenon was observed in our previous study of VHL-responsive genes in the RCC4 background. In view of the results here we reanalysed six of these genes (collagen type 1alpha 1, integrin alpha 5, ferritin light polypeptide, JM4 protein, transgelin, L1 cell adhesion molecule) in the nonrenal cell lines here and they were all hypoxia-responsive in at least one of them (Figure 6).
Comparison of the hypoxic regulation of genes modulated by VHL in renal cell lines with their regulation in nonrenal cell lines. COL1A1 collagen type 1, alpha 1, ITGA5 integrin, alpha 5,— FTL ferritin, light polypeptide, JM4 JM4 protein, TAGLN transgelin, L1CAM L1 cell adhesion molecule; FN1, fibronectin; LC, loading control.
However, another observation in the renal cell lines was that VHL expression had opposite effects in the 786-0 and the RCC4 on certain genes. Restoration of VHL suppressed LICAM and transgelin in the RCC4 cells but induced expression in the 786-0 cells. Thus hypoxia regulation in opposite directions can occur in different cell lines, again reflecting cell type specific operation of hypoxia pathways.
Discussion
This study has provided insight into the role of VHL in the global response to hypoxia. Specifically, at least in the 786-0 background, VHL plays a central and dominant role in eliciting the changes in gene expression generated by hypoxia. In contrast, there was no further consistent gene regulation in response to hypoxia in the absence of a functional VHL gene product.
These results should be compared to the recent SAGE analysis of the same renal cell lines (Jiang et al, 2003). These authors found 38 genes induced by hypoxia in the 786-0/VHL cell in common with those downregulated by re-expression of VHL in 786-0 cells. It is of interest that not one of the genes we found to be regulated in common by the gene array and validated by RNase protection is in that list and our list contains genes previously validated in other studies on renal cancer. This emphasises the importance of different methodologies in analysing gene expression. Some of the differences could be due to different cut points of analysis as well as inherent methodology differences, for example in sequencing and hybridisation.
A novel observation was that a large proportion of genes from our array experiments were significantly regulated by VHL-status but insignificantly regulated by hypoxia in VHL transfectants, while hypoxia-responsive in nonrenal cell lines. One potential factor contributing to this observation is that stable over-expression of exogenous pVHL to a level in excess to that which had previously been present in the precursor cells of the cancer may have an inhibitory effect on some hypoxia-mediated changes in gene expression. Another is that these genes belong to hypoxia pathways that have become modified during progressive development of renal cancer and are no longer responsive. An interesting possibility is that they represent a VHL pathway independent of HIF. Jiang et al (2003) found many more genes by SAGE that were VHL regulated but not hypoxia responsive but they did not test whether they were hypoxia inducible in other cell types.
Other genes we identified as hypoxia regulated in nonrenal cell lines have roles that could contribute to the malignant phenotype, including cell adhesion and VEGF presentation, L1CAM (Castellani et al, 2002), iron metabolism or gelling of the actin cytoskeleton, transgelin.
The genes identified from the current analyses broaden the spectrum of VHL and hypoxia-responsive target genes to include many that have functions of interest to cancer biology. Tumour growth factor alpha, found to be upregulated by VHL mutation and hypoxia in this screen, has recently been shown to have a key role in growth of renal cancers. 14-3-3-epsilon, a cell cycle inhibitor that complexes with cdc2 kinase (van Hemert et al, 2001) was downregulated by VHL mutation and provides a suppression of a second cell cycle checkpoint that would synergise with cyclin D1 changes.
The gene most upregulated by hypoxia and VHL mutation was cyclin D1. Over the past decade, the expression of CCND1 has emerged as being clearly disregulated in a variety of human neoplasms and having a major role in tumorigenesis. Recently Klausner's group specifically analysed the control of the cell cycle in the same cell line and found hypoxia upregulation of CCND1 and maintenance of CCND1 at confluence, which was not related to protein stabilisation. Similarly to their study, this only occurred in cell lines that had lost VHL function and been transfected with VHL (Bindra et al, 2002). In contrast, Maher's group used an array of 558 genes and found CCND1 upregulated in a VHL mutant renal cancer cell line (RCC4), but it was not regulated by hypoxia (Zatyka et al, 2002). This may be due to the problem discussed above where transfection may not restore hypoxia inducibilty of genes in such cells. Our results in that cell line with an inducible VHL clearly show that VHL upregulation produces suppression of CCND1, emphasing the importance of trying to titrate the level of a suppressor gene to determine the effects.
CCND1 protein was downregulated by hypoxia in multiple nonrenal cell lines as previously reported (Conrad et al, 1999; Krtolica et al, 1999), and we show here that this is by an HIF-alpha independent mechanism as shown in two different mutant cell types for HIF1-alpha and one for HIF2-alpha. The mechanism varied in the nonrenal cell lines, for example, in A549 cells the RNA was not hypoxia-responsive in while its protein was down-regulated, whereas in HeLa cells both were downregulated. Taken together, these results indicate that the controls responsible for modulating the CCND1 response to hypoxia are complex and cell type specific. Nevertheless, the renal cell lines stand out as consistently maintaining CCND1 expression under hypoxia in contrast to all other types examined here and reported in the literature. Our findings are in agreement with clinical data that approximately 75% of RCCs expressed a higher level of CCND1 protein than the normal kidney cortex (Lin et al, 1998; Aaltomaa et al, 1999; Hedberg et al, 1999; Stassar et al, 2001).
The renal specificity of transformation by VHL could be partly determined by the signalling pathway we describe here. The mechanism of CCND1 regulation will require further analysis, but a possibility is indirect regulation via TGF alpha or other growth factors regulated by HIF. Differential tissue specific regulation of genes by hypoxia provides a putative reason, for the remarkable specificity of VHL to produce invasive renal tumours. Our work shows three contributing factors – the upregulation of CCND1 in the presence of VHL mutation, downregulation of 14-3-3 epsilon, and lack of an HIF independent hypoxia response that could mediate the suppression of CCND1, as in other cell types. The global gene array has shown that essentially all hypoxia-regulated genes are regulated by VHL in renal cancer contributing to an understanding of tissue selectivity of transformation.
Change history
16 November 2011
This paper was modified 12 months after initial publication to switch to Creative Commons licence terms, as noted at publication
References
Aaltomaa S, Lipponen P, Ala-Opas M, Eskelinen M, Syrjanen K, Kosma VM (1999) Expression of cyclins A and D and p21(waf1/cip1) proteins in renal cell cancer and their relation to clinicopathological variables and patient survival. Br J Cancer 80: 2001–2007
Bindra RS, Vasselli JR, Stearman R, Linehan WM, Klausner RD (2002) VHL-mediated hypoxia regulation of cyclin D1 in renal carcinoma cells. Cancer Res 62: 3014–3019
Castellani V, De Angelis E, Kenwrick S, Rougon G (2002) Cis and trans interactions of L1 with neuropilin-1 control axonal responses to semaphorin 3A. EMBO J 21: 6348–6357
Chen F, Kishida T, Yao M, Hustad T, Glavac D, Dean M, Gnarra JR, Orcutt ML, Duh FM, Glenn G et al (1995) Germline mutations in the von Hippel-Lindau disease tumor suppressor gene: correlations with phenotype. Hum Mutat 5: 66–75
Cockman ME, Masson N, Mole DR, Jaakkola P, Chang GW, Clifford SC, Maher ER, Pugh CW, Ratcliffe PJ, Maxwell PH (2000) Hypoxia inducible factor-alpha binding and ubiquitylation by the von Hippel-Lindau tumor suppressor protein. J Biol Chem 275: 25733–25741
Conrad PW, Rust RT, Han J, Millhorn DE, Beitner-Johnson D (1999) Selective activation of p38alpha and p38gamma by hypoxia. Role in regulation of cyclin D1 by hypoxia in PC12 cells. J Biol Chem 274: 23570–23576
Eberwine J, Yeh H, Miyashiro K, Cao Y, Nair S, Finnell R, Zettel M, Coleman P (1992) Analysis of gene expression in single live neurons. Proc Natl Acad Sci USA 89: 3010–3014
Eisen MB, Spellman PT, Brown PO, Botstein D (1998) Cluster analysis and display of genome-wide expression patterns. Proc Natl Acad Sci USA 95: 14863–14868
Hedberg Y, Davoodi E, Roos G, Ljungberg B, Landberg G (1999) Cyclin-D1 expression in human renal-cell carcinoma. Int J Cancer 84: 268–272
Iliopoulos O, Levy AP, Jiang C, Kaelin Jr WG, Goldberg MA (1996) Negative regulation of hypoxia-inducible genes by the von Hippel-Lindau protein. Proc Natl Acad Sci USA 93: 10595–10599
Ivan M, Kondo K, Yang H, Kim W, Valiando J, Ohh M, Salic A, Asara JM, Lane WS, Kaelin Jr WG (2001) HIFalpha targeted for VHL-mediated destruction by proline hydroxylation: implications for O2 sensing. Science 292: 464–468
Iwai K, Yamanaka K, Kamura T, Minato N, Conaway RC, Conaway JW, Klausner RD, Pause A (1999) Identification of the von Hippel-lindau tumor-suppressor protein as part of an active E3 ubiquitin ligase complex. Proc Natl Acad Sci USA 96: 12436–12441
Jiang YD, Zhang W, Kondo K, Klco JM, St MTB, Dufault MR, Madden SL, Kaelin WG, Nacht M (2003) Gene expression profiling in a renal cell carcinoma cell line: dissecting VHL and hypoxia-dependent pathways. Mol Cancer Res 1: 453–462
Koong AC, Denko NC, Hudson KM, Schindler C, Swiersz L, Koch C, Evans S, Ibrahim H, Le QT, Terris DJ, Giaccia AJ (2000) Candidate genes for the hypoxic tumor phenotype. Cancer Res 60: 883–887
Krtolica A, Krucher NA, Ludlow JW (1999) Molecular analysis of selected cell cycle regulatory proteins during aerobic and hypoxic maintenance of human ovarian carcinoma cells. Br J Cancer 80: 1875–1883
Lal A, Peters H, St Croix B, Haroon ZA, Dewhirst MW, Strausberg RL, Kaanders JH, van der Kogel AJ, Riggins GJ (2001) Transcriptional response to hypoxia in human tumors. J Natl Cancer Inst 93: 1337–1343
Latif F, Tory K, Gnarra J, Yao M, Duh FM, Orcutt ML, Stackhouse T, Kuzmin I, Modi W, Geil L et al (1993) Identification of the von Hippel-Lindau disease tumor suppressor gene. Science 260: 1317–1320
Lin BT, Brynes RK, Gelb AB, McCourty A, Amin MB, Medeiros LJ (1998) Cyclin D1 expression in renal carcinomas and oncocytomas: an immunohistochemical study. Mod Pathol 11: 1075–1081
Maxwell PH, Wiesener MS, Chang GW, Clifford SC, Vaux EC, Cockman ME, Wykoff CC, Pugh CW, Maher ER, Ratcliffe PJ (1999) The tumour suppressor protein VHL targets hypoxia-inducible factors for oxygen-dependent proteolysis. Nature 399: 271–275
Semenza GL (1999) Regulation of mammalian O-2 homeostasis by hypoxia-inducible factor 1. Annu Rev Cell Dev Biol 15: 551–578
Stassar MJ, Devitt G, Brosius M, Rinnab L, Prang J, Schradin T, Simon J, Petersen S, Kopp-Schneider A, Zoller M (2001) Identification of human renal cell carcinoma associated genes by suppression subtractive hybridization. Br J Cancer 85: 1372–1382
Tenenbaum JB, de Silva V, Langford JC (2000) A global geometric framework for nonlinear dimensionality reduction. Science 290: 2319–2323
van Hemert MJ, Steensma HY, van Heusden GP (2001) 14-3-3 proteins: key regulators of cell division, signalling and apoptosis. Bioessays 23: 936–946
Wiesener MS, Turley H, Allen WE, Willam C, Eckardt KU, Talks KL, Wood SM, Gatter KC, Harris AL, Pugh CW, Ratcliffe PJ, Maxwell PH (1998) Induction of endothelial PAS domain protein-1 by hypoxia: characterization and comparison with hypoxia-inducible factor-1alpha. Blood 92: 2260–2268
Wood SM, Wiesener MS, Yeates KM, Okada N, Pugh CW, Maxwell PH, Ratcliffe PJ (1998) Selection and analysis of a mutant cell line defective in the hypoxia-inducible factor-1 alpha-subunit (HIF-1alpha). Characterization of hif-1alpha-dependent and -independent hypoxia-inducible gene expression. J Biol Chem 273: 8360–8368
Wykoff C, Pugh CW, Maxwell PH, Harris AL, Ratcliffe PJ (2000) Identification of novel hypoxia dependent and independent target genes of the von Hippel-Lindau (VHL) tumour suppressor by mRNA differential expression profiling. Oncogene 19: 6297–6305
Zatyka M, da Silva NF, Clifford SC, Morris MR, Wiesener MS, Eckardt KU, Houlston RS, Richards FM, Latif F, Maher ER (2002) Identification of cyclin D1 and other novel targets for the von Hippel-Lindau tumor suppressor gene by expression array analysis and investigation of cyclin D1 genotype as a modifier in von Hippel-Lindau disease. Cancer Res 62: 3803–3811
Acknowledgements
The Welcome Trust (PJR, MEC, PM), Cancer Research UK (ALH), NCI (CS, EL) and Marshall Foundation (CCW) supported this work.
Author information
Authors and Affiliations
Corresponding author
Rights and permissions
From twelve months after its original publication, this work is licensed under the Creative Commons Attribution-NonCommercial-Share Alike 3.0 Unported License. To view a copy of this license, visit http://creativecommons.org/licenses/by-nc-sa/3.0/
About this article
Cite this article
Wykoff, C., Sotiriou, C., Cockman, M. et al. Gene array of VHL mutation and hypoxia shows novel hypoxia-induced genes and that cyclin D1 is a VHL target gene. Br J Cancer 90, 1235–1243 (2004). https://doi.org/10.1038/sj.bjc.6601657
Received:
Revised:
Accepted:
Published:
Issue Date:
DOI: https://doi.org/10.1038/sj.bjc.6601657
Keywords
This article is cited by
-
The renal lineage factor PAX8 controls oncogenic signalling in kidney cancer
Nature (2022)
-
Sonic Hedgehog Agonist Protects Against Complex Neonatal Cerebellar Injury
The Cerebellum (2018)
-
The Role of Hypoxia and Cancer Stem Cells in Renal Cell Carcinoma Pathogenesis
Stem Cell Reviews and Reports (2015)
-
Clinical utility gene card for: von Hippel–Lindau (VHL)
European Journal of Human Genetics (2014)
-
Common genetic variants at the 11q13.3 renal cancer susceptibility locus influence binding of HIF to an enhancer of cyclin D1 expression
Nature Genetics (2012)


