Abstract
The proteasome inhibitor bortezomib, which induces cell death in various cancer cell lines including lymphatic neoplasias, has recently been approved for the treatment of relapsed multiple myeloma. Important mechanisms of proteasome inhibitor-mediated tumor cell death are the inhibition of NF-κB activation and induction of the terminal unfolded protein response (UPR). However, little is known about effects of bortezomib on developing and mature lymphocytes. Therefore, Balb/C mice were injected with bortezomib and lymphocyte subsets were analyzed. This treatment resulted in dramatically decreased numbers of T and B lymphocyte precursors, while mature lymphocytes were only partially affected. Thymocytes were almost depleted 3 days after a single bortezomib injection, pro-B and pre-B cells already after 2 days. Thymocytes and B cell precursors recovered within 2 weeks. The decreased numbers of developing lymphocytes were due to apoptotic cell death accompanied by strongly increased caspase 3/7 activity. Within 8 h after bortezomib injection, there was a strong induction of heat shock protein 70 and C/EBP homologous protein in bone marrow B cells, indicating endoplasmic reticulum stress and activation of the terminal UPR, respectively. Hence, induction of apoptosis by proteasome inhibition can dramatically affect lymphocyte development, a fact which has important implications for the clinical use of bortezomib, especially in situations with ongoing lymphopoiesis.
Main
Degradation of intracellular proteins is a tightly controlled process regulating protein homeostasis as well as the concentrations of critical signaling and regulatory proteins. Correct function of the ubiquitin–proteasome machinery is critically involved in cellular processes, such as cell survival, cell cycle control,1, 2, 3, 4 antigen processing,5 removal of nonreceptor kinases, cell adhesion, and migration.6 Also activation of the antiapoptotic transcription factor nuclear factor-kappa B (NF-κB) requires degradation of its inhibitory proteins, so called inhibitors of kappa B (IκBs), by the ubiquitin–proteasome pathway. Stimulation of multiple immunologically relevant receptors such as the T-cell receptor (TCR), B-cell receptor (BCR), TNF receptors (TNFRs), and CD40 leads to NF-κB activation via IκB degradation.7 In addition, proteasomes mediate the removal of misfolded proteins and defective ribosomal products.8
Bortezomib, a dipeptidyl boronic acid derivative, represents the only proteasome inhibitor in routine clinical use to date. Bortezomib has been approved for treatment of multiple myeloma progressing on prior therapy.4, 9 Selective induction of cell death mediated by proteasome inhibition has been well documented in various malignancies, among them multiple myeloma, ovarian cancers, leukemias, and T and B cell lymphomas.4, 10 However, the effects of proteasome inhibition on non-malignant developing and mature lymphocytes remain largely unknown.
Both T and B cells arise from common lymphoid precursors and share important features, including crucial genomic rearrangements and clonal expansion. Thymocytes progress through the CD4/CD8 double-negative (DN, CD4−CD8−) stages DN1, DN2, DN3, and DN4 to the double-positive (DP, CD4+CD8+) stage and ultimately select a single positive fate (SP, CD4+ or CD8+) before emigrating from thymus. Only cells with functional TCRβ gene rearrangement can form a pre-TCR, which induces NF-κB activation preventing apoptotic cell death and enabling transition from DN3 to DN4.11 Thymocytes with functional TCRβ rearrangement develop thus further into DP thymocytes, which rearrange the TCRα gene and, consequently, undergo TCR-driven positive and negative selection.12
In analogy, B cells mature from hematopoietic stem cells in the bone marrow through developmental stages characterized by the expression of surface markers defining the pro-B, pre-B, and immature B cells, which migrate to peripheral lymphoid organs and differentiate into mature B cells. During development, B cells must traverse checkpoints for functional Ig chain rearrangements enabling expression of the pre-B and mature BCR, respectively.13 NF-κB activation by the pre-BCR supports selective survival at the pro-B to pre-B cell transition,14, 15 respectively. Furthermore, a certain level of constitutive NF-κB activity appears to be essential for survival of mature B cells.16 Hence, we hypothesized that developing lymphocytes at critical checkpoints and some mature B cells, which all require NF-κB activity and are hypersensitive to specific inhibition of NF-κB,11, 14, 15 should be hypersensitive toward proteasome inhibitors.
The unfolded protein response (UPR), triggered by the accumulation of misfolded proteins within the lumen of the endoplasmic reticulum (ER),17 leads to increased synthesis of chaperones, generally reduced protein biosynthesis, and induction of antiapoptotic factors, thereby enabling cell survival.8, 18 However, prolonged excessive ER overload, which can be caused by proteasome inhibition, induces the terminal UPR with concomitant activation of C/EBP homologous protein (CHOP) and caspase 12 resulting in apoptotic cell death.19, 20 Contradictory results regarding the pro- or antiapoptotic role of proteasome inhibition in lymphocytes have been reported.2, 21, 22, 23 In this study, we investigated the effects of bortezomib on developing lymphocytes in vivo and ex vivo. Proteasome inhibition drastically impaired both B and especially T lymphocyte development by inducing apoptosis concomitant with caspases 3/7 activation. This coincided with increased CHOP and heat shock protein (Hsp)70 expression in B cells and – to a lesser extent – in T cells, indicating that activation of the terminal UPR by bortezomib may represent a leading mechanism for apoptotic cell death in developing lymphocytes.
Results
In vivo proteasome inhibition dramatically reduces lymphocyte numbers in primary lymphoid organs
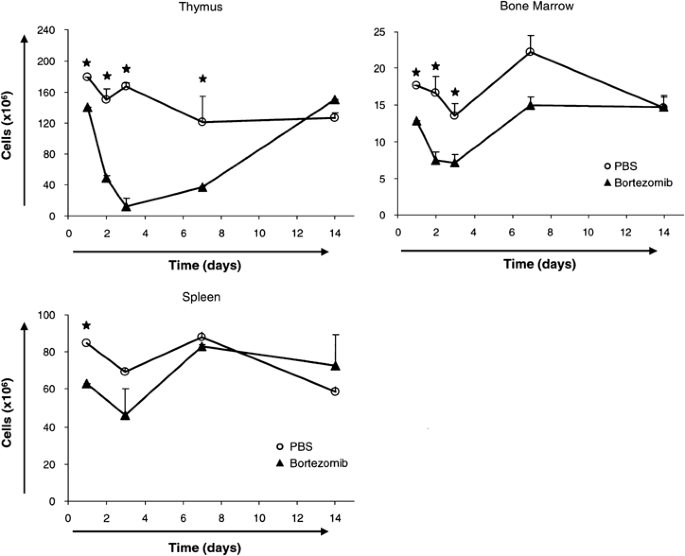
To investigate the effects of the proteasome inhibitor bortezomib on developing and mature lymphocytes, we intravenously injected a single dose of bortezomib and subsequently analyzed lymphocyte sub-populations in thymus, bone marrow, and spleen over a period of 2 weeks. In dose escalation experiments, maximal depletion of developing lymphocytes was reached at a single bortezomib dose of 0.75 and 1.0 mg/kg, whereas a 0.5 mg/kg dose caused only a moderate decrease in cellularity both in thymus and bone marrow (not shown). Hence, we used 0.75 mg/kg bortezomib in all subsequent experiments. Mice did not display any overt signs of toxicity.
As shown in Figure 1, the cellularities of thymus and bone marrow were strongly decreased by bortezomib, while numbers of nucleated spleen cells were not markedly affected. These data indicate a focused impact of proteasome inhibition on developing lymphocytes, leaving mature splenic T and B lymphocyte populations largely unaffected.
Influence of bortezomib treatment on cellularities of thymus, bone marrow, and spleen. Absolute cell numbers of total thymocytes, bone marrow B cells and splenocytes of PBS (control), and bortezomib (0.75 mg/kg)-injected mice. Each value represents the mean of the cellularity of three organs counted by trypan blue dye exclusion capacity of vital cells using a hemocytometer. The asterisk (*) indicates P<0.05 with N=3 calculated by Student's t-test for unpaired heteroscedastic samples
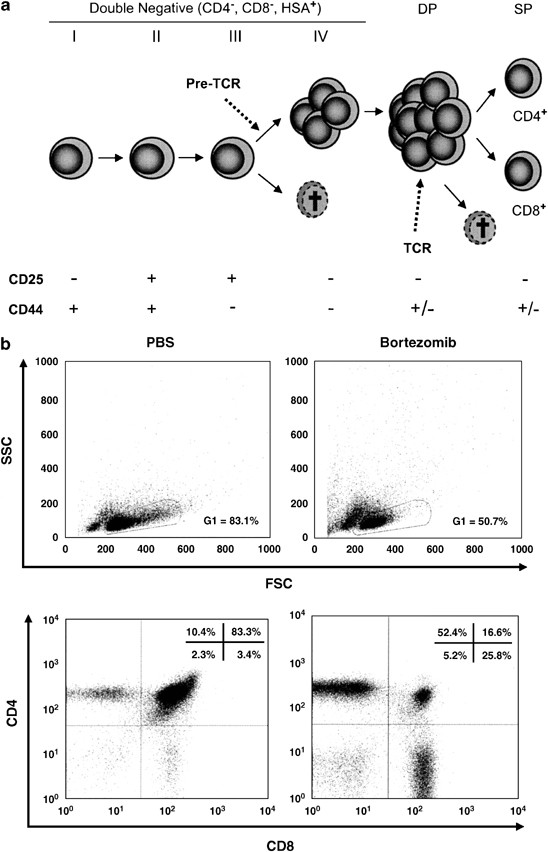
Organ cellularity started to decrease both in thymus and bone marrow within 24 h after bortezomib injection and reached its nadir at day 3. At this time point, the thymi were almost completely devoid of thymocytes (Figure 1). We cannot exclude some decrease of stroma cell numbers or influence on their function by bortezomib; however, the main effect occurs directly on the lymphocytes, as evidenced by flow cytometric analyses (Figures 2 and 3) and in vitro experiments (Figure 4b and c).
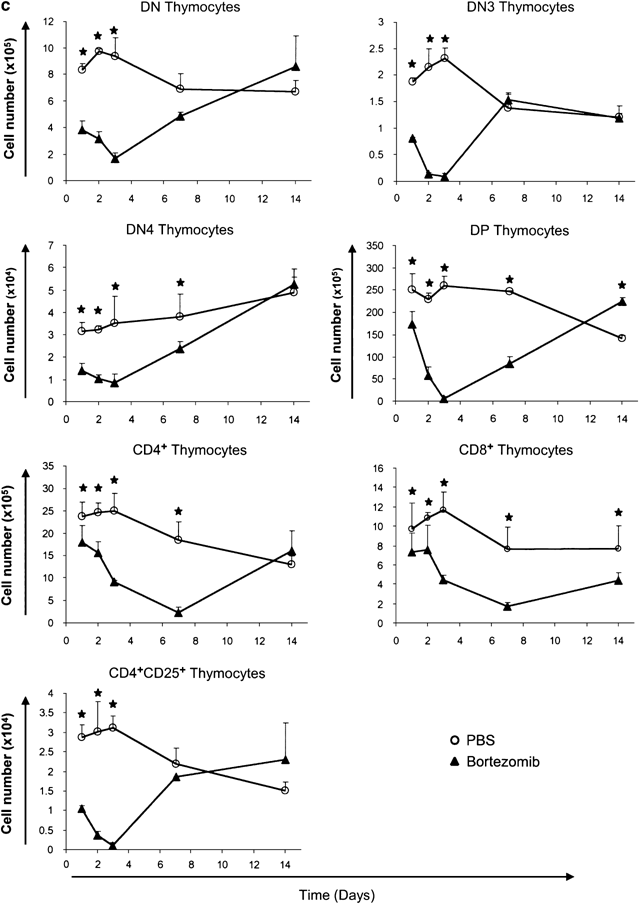
Effect of bortezomib on developing T cell sub-populations. (a) Overview of T cell development in the thymus. (b) Representative lymphocyte gates of FSC-SSC analyses and CD4/CD8 dot plots at day 3 of the (PBS-) and bortezomib-treated mice. The percentages of cells in each quadrant are indicated. (c) Absolute cell numbers of thymocyte sub-populations 1, 2, 3, 7, and 14 days after bortezomib injection. Circles represent PBS-treated mice, whereas triangles represent bortezomib treated mice. The asterisk (*) indicates P<0.05 with N=3 calculated by Student's t-test for unpaired heteroscedastic samples
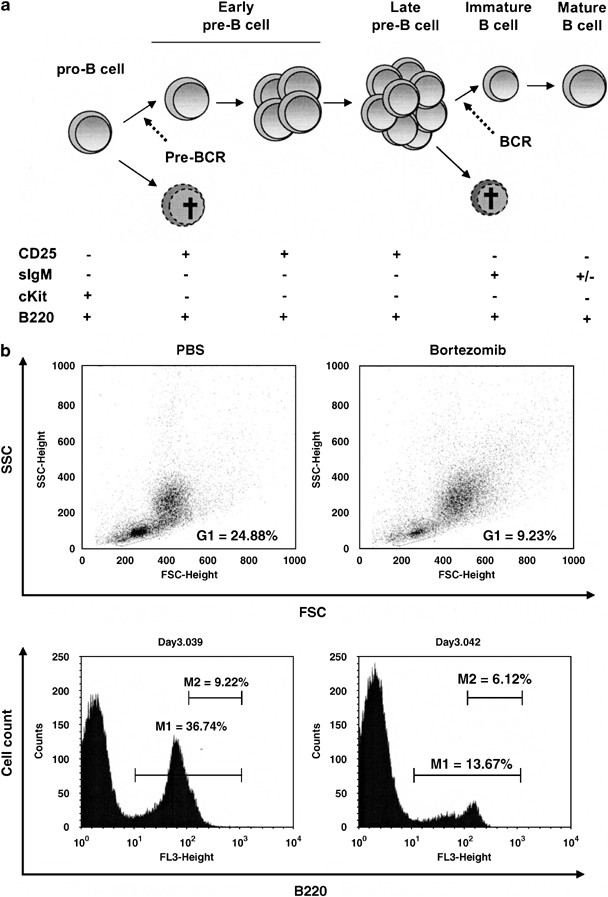
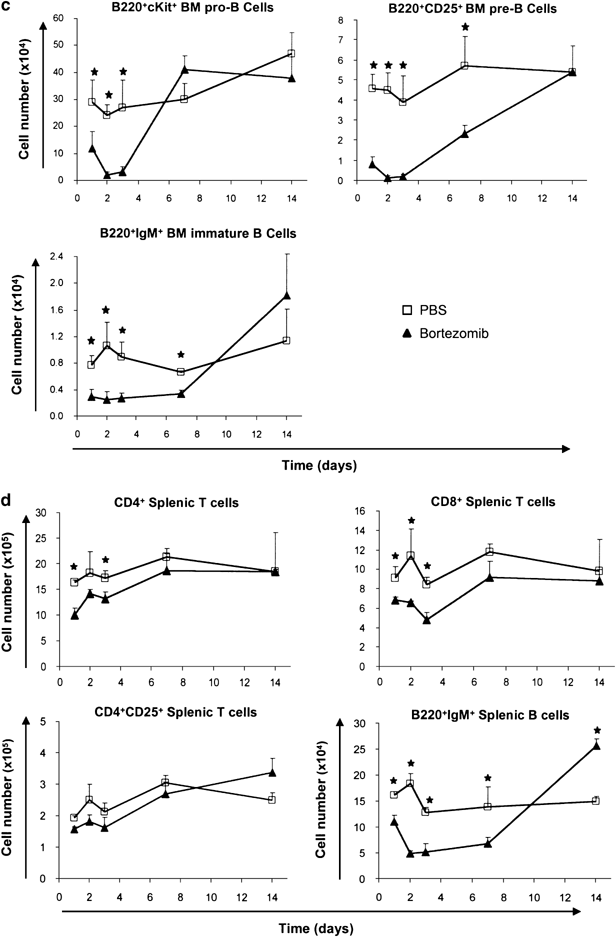
Effects of bortezomib on developing B cells and mature peripheral lymphocyte sub-populations. (a) Overview of B-cell development in the bone marrow. (b) Representative lymphocyte gates of FSC-SSC analyses and B220 histograms on lymphocyte gates at day 3 after bortezomib injection. (c) Sensitivity of bone marrow B cell sub-populations to bortezomib treatment over a 14 days period. (d) Peripheral splenic lymphocyte populations. Squares represent PBS-treated mice, while triangles represent bortezomib treated mice. The asterisk (*) indicates P<0.05 with N=3 calculated by Student's t-test for unpaired heteroscedastic samples
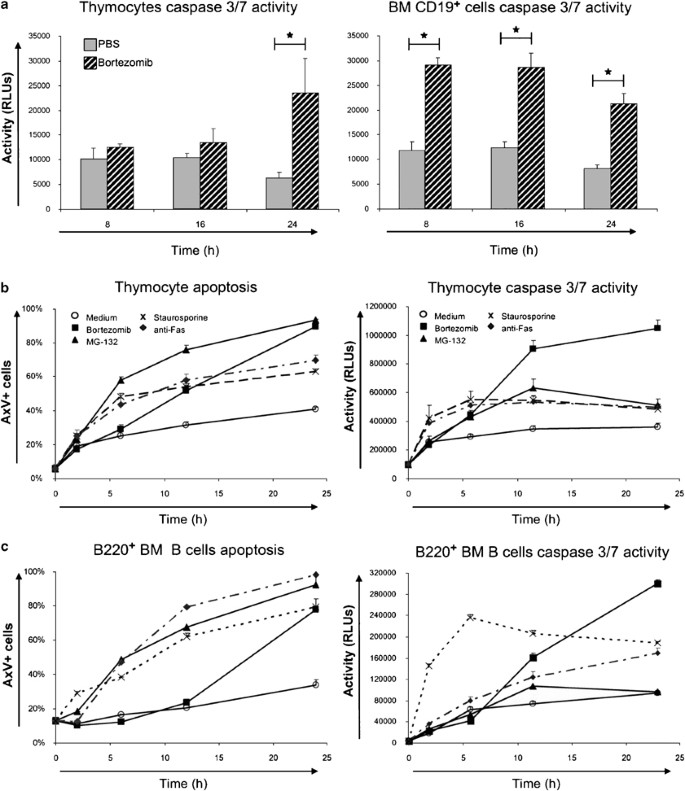
Bortezomib treatment causes activation of caspase 3/7 and apoptotic cell death. (a) Caspases 3 and 7 activation during the first 24 h in control- and bortezomib-treated mice after a single injection of 0.75 mg/kg bortezomib. Both total thymocytes and CD19+ bone marrow cells are shown. (b) In vitro cell death as a measure of surface AxV+ cells and caspase 3/7 activity in thymocytes cultivated in T cell medium alone or supplemented with 1 μM bortezomib or MG-132. Controls show the corresponding staurosporine (1 μM) and anti-Fas (100 ng/ml) treatments (discontinuous lanes). (c) Apoptosis and caspase 3/7 activity in isolated B220+ bone marrow B cells
The cellularities of thymus and bone marrow were fully restored to levels of control mice after 14 days. This rapid repopulation of bone marrow and thymus with lymphocytes indicates that bortezomib has no profound or long-lasting effect on lymphatic stem cells.
Differential effects of bortezomib on developing and mature T-cell subsets
Flow cytometric analyses of thymocytes revealed that 24 h after bortezomib injection, the early developmental stages, that is DN cells, were more intensely decreased than the later developmental stages, namely DP and SP thymocytes. At day 3, DN3 and DP thymocytes were almost completely absent. At later time points, the decrease in cell numbers became more pronounced also in the later developmental stages such as CD4+ SP and CD8+ SP thymocytes reaching their nadir around day 7, when numbers of earlier developmental stages had already partially or fully recovered (Figure 2c). This late nadir of CD4+ SP and CD8+ SP mature thymocytes, which appeared to be less sensitive toward direct killing by bortezomib, is most likely caused by mature thymocytes exiting the thymus while not being replenished from the DP cells. Noteworthy, CD8+ SP thymocytes were the only sub-population that had not fully recovered by day 14. CD25+ CD4+ SP cells, which mainly represent thymic regulatory T cells, were almost completely depleted 3 days after bortezomib injection (Figure 2c). DP thymocytes represented the most strongly decreased sub-population. Direct induction of cell death in DP thymocytes as well as a lack of incoming newly generated precursors from the DN compartment may act together to cause this virtually complete depletion (Figure 2c). Numbers of mature peripheral splenic CD4+ and CD8+ T cells were barely affected during the observation period of 14 days (Figure 3d).
Since proteasomal function is mandatory to achieve peptide loading of major histocompatibility complex class I (MHCI) molecules, proteasome inhibition could interfere with thymic selection and, thereby, influence survival of DP and especially CD8+ SP thymocytes.5, 24 However, using CD69 as marker to track positive selection, we detected significantly increased absolute and relative numbers of TCRβ+ CD69+ cells in DP, CD8+ SP, and CD4+ SP subsets at day 2 and day 7 after bortezomib injection (Supplementary Figure 1a and b). Hence, we have no evidence for impaired positive selection due to deregulated MHC presentation in the thymus. Presumably, the transient and only partial inhibition of proteasomal function (up to approximately 80%), which can be achieved by bortezomib in vivo,25 does not markedly impair peptide loading of MHCI molecules. Furthermore, cytofluorometric analyses of thymocyte sub-populations did not reveal marked alterations in the TCRβ expression profiles at any time point (Supplementary Figure 2).
Differential effects of bortezomib on developing and mature B cell subsets
Regarding B lymphopoiesis within the bone marrow, various subsets were markedly decreased upon bortezomib treatment. Total B220+ B cells were decreased to 30% in respect to control bone marrow cells at day 3. However, it should be noticed that a small fraction of B cells, which were B220bright and represented mature, long-living, and re-circulating B cells, was much less affected (Figure 3b). Both pro-B and pre-B cell subsets were almost completely depleted 2 days after bortezomib injection, but started to recover after day 3. Pro-B cells reached normal cell numbers already by day 7, pre-B cells thereafter, most likely due to delayed replenishment from the pro-B cell population (Figure 3c). Immature B cells were decreased by approximately 75% for 7 days after bortezomib injection before beginning to recover. In summary, bortezomib application rapidly affected all developing B cells; however, pro-B and pre-B cells were most strongly decreased.
Analyses of mature B cells in the periphery revealed that numbers of splenic B220+ IgM+ B cells dropped to approximately 30% of controls. Minimal counts were reached at day 2, while cell numbers started to recover after day 7 (Figure 3d). Total B220+ B cells were decreased only to 70–80% (not shown).
Massive apoptosis causes depletion of developing lymphocytes
In order to elucidate the mechanisms accounting for the strongly reduced numbers of developing lymphocytes after bortezomib treatment, we monitored the activities of caspases 3 and 7 during the first 24 h. Treatment of mice with bortezomib resulted in increased caspase 3/7 activity both in thymocytes and CD19+ bone marrow B cells (Figure 4a). Caspase activation occurred earlier in bone marrow B cells than in thymocytes (peaks at 8 and 24 h, respectively). Apoptosis detection by AxV/PI staining of freshly isolated cells displayed only a moderate increase in numbers of apoptotic lymphocytes upon bortezomib treatment (not shown). Most likely, the low numbers of dying cells detectable are explained by the highly efficient clearance of apoptotic cells in vivo.26 In vitro, thymocytes and bone marrow B cells undergoing cell death upon bortezomib treatment showed first an AxV+/PI− phenotype and then became permeable for PI at longer time intervals, indicating apoptotic cell death with subsequent progression to secondary necrosis (Figure 4b and c and data not shown).
To evaluate if apoptosis induction in thymocytes depends on the thymic environment, we isolated primary thymocytes and bone marrow B cells and cultured them in vitro for 24 h in the presence or absence of different inducers of apoptosis. Antimurine Fas mAb was added to induce receptor-mediated apoptosis, while staurosporine was used as a surface receptor-independent inducer of apoptosis. In addition, the proteasome inhibitor MG132 was used in comparison with bortezomib. Proteasome inhibition with bortezomib was very potent in inducing apoptotic cell death, especially after 24 h (Figure 4b and c).
In the case of in vitro cultures of thymocytes, an increase of apoptotic cell death was preceded by caspase 3/7 activation and detected before phosphatidylserine exposure upon bortezomib treatment. All apoptosis inducers tested including anti-Fas mAb, staurosporine, and MG132 enhanced annexin V binding as well as caspase 3/7 activity in vitro. At later time points, bortezomib was very potent regarding caspase 3/7 activity increase (Figure 4b).
Compared to thymocytes, isolated B220+ bone marrow B cells exerted a similar behavior and reached finally a similar extent of cell death. Staurosporine and anti-Fas treatments triggered more apoptotic cell death and caspase activation in isolated bone marrow B cells than in thymocytes (Figure 4b and c). In summary, these results in purified T and B lymphocytes indicate that proteasome inhibition can induce apoptosis in a lymphocyte-autonomous fashion.
Activation of the terminal UPR by bortezomib in thymocytes and bone marrow B cells
The possible pathways underlying the observed induction of apoptosis are diverse. We suspected the implication of ER stress response and terminal UPR-related mechanisms, which we and others have described for myeloma cells.20, 27 Therefore, we performed western blot analyses to detect pro- and anti-apoptotic factors as well as critical components of the UPR.
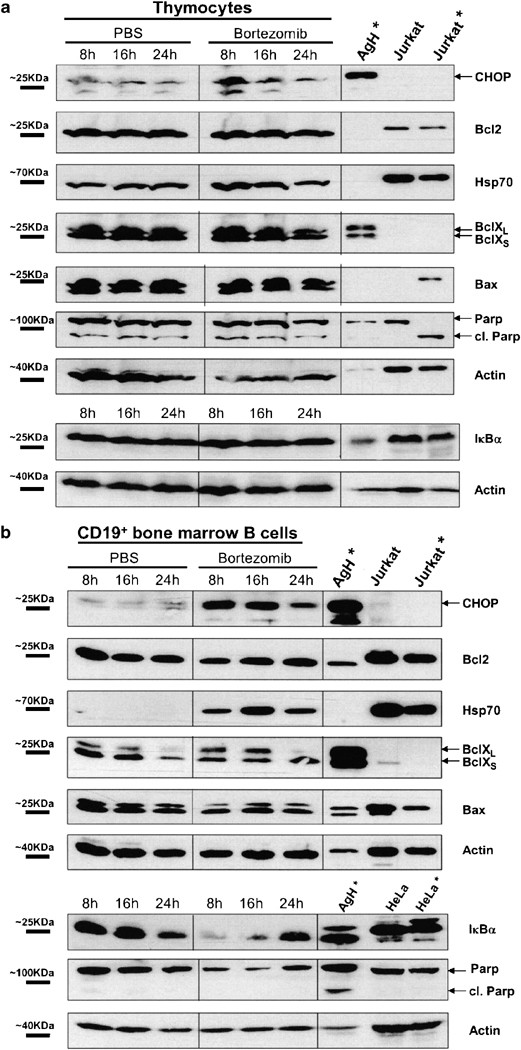
Thymocytes depicted an increase in the concentrations of CHOP protein and mRNA, indicating activation of the terminal UPR (Figures 5a and 6b). The Bcl-2, Bcl-X, Bax, and PARP protein concentrations were not markedly altered by bortezomib treatment (Figure 5a). Additionally, we observed a moderate increase of Hsp70 protein concentrations 8 and 16 h after bortezomib administration in thymocytes, while in CD19+ bone marrow B cells, the increase of Hsp70 concentrations was dramatic (Figure 5).
Apoptotic cell death of thymocytes and bone marrow B cells is due to terminal UPR activation. Western blots depicting CHOP, Bcl-2, Bcl-X, PARP, Hsp70, and Bax concentrations in PBS and bortezomib treated mice 8, 16, and 24 h after bortezomib injection. Both thymocytes (a) and CD19+ isolated bone marrow B cells (b) were analyzed. Murine Ag8.H* cells stimulated with tunicamycin at 5 μg/ml for 6 h were used as a positive control for UPR-induced factors. Other controls represent extracts from untreated or 6 h staurosporine-treated Jurkat cells (Jurkat*). Concentrations of IκBα and PARP proteins with additional controls (HeLa cells treated with bortezomib 500 nM (*)for 12 h or untreated HeLa cells) in thymocytes and CD19+ bone marrow cells
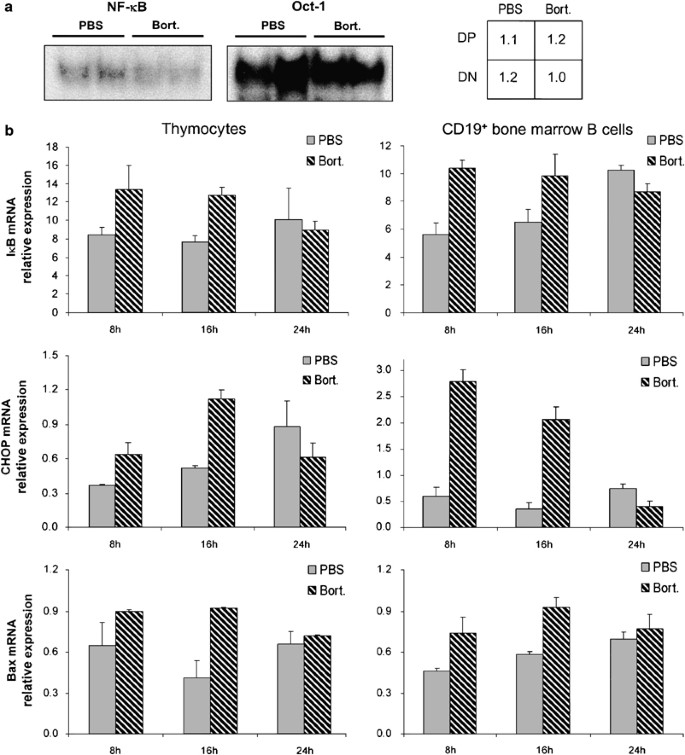
NF-κB activity, IκBα, CHOP, and Bax mRNA levels after bortezomib treatment. (a) EMSAs showing the NF-κB (left panel) and Oct-1 (middle panel) nuclear DNA-binding activity of DP thymocytes isolated from mice 8 and 16 h after bortezomib versus PBS injection. The table (right panel) indicates the ratio of NF-κB to Oct-1 band intensity of mice treated with bortezomib (Bort) compared with control mice (PBS). (b) Relative mRNA expression levels as measured by real-time RT-PCR of IκBα, CHOP, and Bax 8, 16, and 24 h after bortezomib injection. Standard deviations were calculated from triplicate analyses for each sample
In CD19+ bone marrow B cells, a strong increase of proapoptotic CHOP indicating activation of the terminal UPR occurred 8 h after bortezomib administration and was maintained for 24 h (Figure 5b). These results were further confirmed at mRNA level, as CHOP mRNA exerted a four- to five-fold increase at 8 and 16 h after bortezomib administration (Figure 6b). In contrast, other important regulators of apoptosis, such as Bcl-2, Bcl-X, and Bax were not markedly altered. The amounts of PARP decreased in bone marrow B-lineage cells upon bortezomib treatment, however, without appearance of the caspase-cleaved PARP fragment (Figure 5b).
Minor modulation of NF-κB activity by bortezomib in developing lymphocytes
Next, we analyzed the activity of the transcription factor NF-κB, since it is an important survival factor during certain stages of lymphocyte development and its activation is dependent on proteasome-mediated degradation of the inhibitory IκB proteins.11, 15, 28 Unexpectedly, the IκBα protein concentrations transiently decreased in bone marrow B cells after bortezomib injection of the mice, indicating potential NF-κB activation by bortezomib, possibly due to induction of ER stress. There was no evidence for IκBα degradation in thymocytes (Figure 5a). The DNA-binding activities of nuclear NF-κB and Oct-1, which is a constitutively expressed transcription factor, were not markedly altered upon bortezomib treatment (Figure 6a). To evaluate the transcriptional activity of NF-κB, we quantified IκBα mRNA by real-time RT-PCR, since IκBα transcription is strongly induced by NF-κB. The IκBα mRNA concentrations were slightly increased by bortezomib treatment in thymocytes and in bone marrow B cells at 8 and 16 h (Figure 6b). In summary, these data argue against NF-κB inhibition being the major cause for the profound depletion of developing lymphocytes.
Discussion
Bortezomib is the first proteasome inhibitor approved for clinical use. However, its potential effects on lymphopoiesis are largely unknown and, among T cells, mainly mature T lymphocytes have been a matter of research.6, 21, 29 Bortezomib can induce selective apoptosis in some mature T cells and decreases Th1 responses among alloreactive T lymphocytes.29 Since activation of the transcription factor NF-κB plays a crucial role during defined stages of T and B cell development7, 30 and NF-κB activation can be blocked by proteasome inhibitors,28, 31 we investigated the influence of bortezomib on developing and mature murine lymphocytes both in vivo and in vitro.
At doses of 0.75 mg/kg, which had been previously used for treatment of myeloma and T-cell leukemia in mouse models,10 bortezomib induced drastic depletion of most developmental stages of T and B lymphocytes. Unexpectedly, lymphocyte depletion was not associated with an inhibition of NF-κB DNA-binding and transcriptional activity. In bone marrow B cells, transient IκBα protein degradation was observed 8 and 16 h after bortezomib treatment corresponding with moderately increased IκBα mRNA concentrations, which even indicate some NF-κB activation. Most likely, bortezomib-induced ER stress and UPR activation lead to IκBα degradation and increased somewhat the transcriptional NF-κB activity in spite of the partially inhibited proteasomes. In addition, the T and B lymphocyte subsets depleted by bortezomib treatment were not restricted to those with known dependence on NF-κB for their survival.11, 14, 15, 28 For instance, there is relatively little NF-κB activity and sensitivity toward NF-κB inhibitors in DP thymocytes.11 Therefore, alternative mechanisms triggered by proteasome inhibition may play dominant roles in bortezomib-mediated cell death.
The most affected lymphocyte sub-populations were T and B cell precursors, especially the DN3 and DP compartments in the thymus and the B220+ cKit+ pro-B cells and the B220+ CD25+ pre-B cells in the bone marrow. In addition, CD4+ CD25+ thymocytes, mainly consisting of natural regulatory T cells, were virtually depleted from the thymus, whereas CD4+ CD25+ regulatory T cells in the spleens were not affected.
Concomitant to cell death, activation of effector caspases 3 and 7 was detected. Proteasome inhibitors can activate downstream caspases at least in part through Smac/DIABLO stabilization.3 Our data also demonstrate effector caspase activation due to proteasome inhibitor treatment. However, the exact molecular mechanisms involved in bortezomib-induced cell death may differ in distinct developmental stages or between T and B cells and remain to be fully elucidated.
We have recently demonstrated that activation of the terminal UPR can be triggered by bortezomib, at least in cells producing large amounts of immunoglobulins or other ER-synthesized proteins.20 In this report, we demonstrate a strong increase in the expression of the terminal UPR component CHOP and the chaperone Hsp70 in bone marrow B cells from mice treated with bortezomib, both at the protein and mRNA levels. Similar results were also observed for thymocytes, although less pronounced (Figures 5 and 6). Overexpression of Hsp27, Hsp70, and Hsp90 has been previously described to overcome bortezomib-induced cell death in the B-lymphoma cell line SUDHL-6, whereas c-Jun and caspase 3 overexpression sensitized this cell line toward apoptosis.32 Interestingly, the Hsp70 machinery delivers misfolded proteins to the proteasome33 and, according to our present data and previous reports,33, 34 Hsp70 is induced by accumulation of unfolded proteins. Bax-dependent release of apoptosis-promoting proteins from mitochondria can trigger CHOP and Bcl-XL expression.35, 36 However, proteins that are highly relevant in apoptosis regulation such as Bcl-2 and Bcl-X were not markedly altered by bortezomib (Figure 5). Bax protein concentrations were not markedly changed, although we detected an upregulation of Bax mRNA during the first 16 h (Figure 6b). Hence, modulation of Bcl-2 family members appears not to represent the primary mechanism of apoptosis caused by proteasome inhibition.
In bone marrow B cells, a substantial decrease of PARP was observed 8 and 16 h after bortezomib injection. In spite of the decrease in full-length PARP, we could not detect corresponding PARP cleavage products, possibly due to immediate further degradation. There was no evidence for PARP cleavage in thymocytes. This unexpected finding might be explained by the fact that PARP cleavage is a relatively late event during apoptotic cell death, while, in vivo, the majority of apoptotic thymocytes are rapidly removed in the early phases of apoptosis.26 Additionally, PARP cleavage is strongly dependent on the cell type and the apoptosis inducing agent.37
The mechanisms underlying bortezomib-induced apoptosis might follow a particular pathway, which does not rely exclusively on prototypical endogenous or exogenous apoptotic pathways. Our results imply that the adaptation of lymphocytes to the stress induced by proteasome inhibition displayed some key features of the terminal UPR-induced cell death in bone marrow B cells. Normally, UPR leads also to a marked activation of NF-κB, which in turn induces the transcription of several anti-apoptotic genes, including several Bcl-2 family members. Since we observed a strong induction of the terminal UPR component CHOP without a marked increase of NF-κB activity or other key anti-apoptotic proteins, this situation may cause a dominance of pro-apoptotic factors, ultimately leading to apoptosis of developing lymphocytes.
In contrast to bone marrow B cells, bortezomib exerted only a moderate upregulation of CHOP in thymocytes, which implies additional pro-apoptotic mechanisms being triggered. These mechanisms may induce apoptosis in a thymocyte-autonomous manner by enhancing autophagy, which is a critical process of cell death especially in the thymus.38 In addition, the very recently described β5t proteasome subunit, expressed exclusively in cortical thymic epithelial cells39 may be differentially affected by bortezomib, a matter which could explain the different recovery of CD4+ and CD8+ SP thymocytes.
Our findings have important implications for potential future proteasome inhibitor treatments in children, who still have significant ongoing lymphopoiesis. Even adult patients can regain a considerable level of B and T cell lymphopoiesis after hematopoietic stem cell transplantation.40 According to our data, proteasome inhibitors cause severe but transient impairment of ongoing lymphopoiesis, after a single injection. However, long-term treatment with proteasome inhibitors in children or after stem cell transplantation may substantially alter and delay the regeneration of the lymphocyte repertoire. Furthermore, the preferential sensitivity of developing lymphocytes may indicate that lymphatic neoplasias resembling stages of lymphocyte development could display a favorable response to proteasome inhibition.
Materials and Methods
Reagents, mice treatment, and cell culture
BALB/c mice of 6–8 weeks of age were purchased from Charles River laboratories Inc. and maintained at the animal facilities of the University Hospital Erlangen. Three to five age-matched female mice received a single injection into the tail vein with either PBS alone or bortezomib (Velcade®, obtained from the Pharmacy of the University Hospital of Erlangen) dissolved in PBS at doses of 0.25, 0.5, 0.75, or 1 mg/kg. For all data shown in this report, the 0.75 mg/kg dose was selected, since it displayed maximal effects on lymphocytes without overt signs of toxicity. In addition, this dose had been reported to show specific activity in murine cancer models.10 Mice were killed and cells from different organs were analyzed 8 h, 16 h, 24 h, 2 days, 3 days, 7 days, and 14 days after a single injection of bortezomib.
Freshly isolated lymphocytes were cultured in RPMI medium supplemented with 10% fetal calf serum (FCS), 100 U/ml penicillin, 100 μg/ml streptomycin, 20 mM HEPES, and 50 μM β-mercaptoethanol (all from Invitrogen GmbH, Karlsruhe, Germany) in 96-well round bottom plates at 100 000 cells/well. Proteasome inhibitors (bortezomib or MG132 at 0.5 or 1 μM) and inducers of apoptosis (1 μM staurosporine, 100 U/ml anti-Fas (BD Pharmingen no. 554285) monoclonal antibody (mAb), or 1 μM dexamethasone) were added to the culture medium as indicated.
Western blot and electromobility shift assay analyses
Equal numbers of cells (2–4 × 10⁶) were washed with PBS and directly lysed in SDS sample buffer containing β-mercaptoethanol to generate total cell lysates from either sorted or unsorted cells. Alternatively, whole cell lysates were obtained after 30 min incubation with radioimmunoprecipitation assay buffer at 4°C.
Proteins were separated by SDS-PAGE using a 10% gel and blotted onto a PVDF membrane. Blocking of the membrane was carried out with 5% nonfat milk powder or 2% bovine serum albumin in PBS containing 0.05% Tween-20. Blots were probed with respective antibodies and visualized using enhanced chemiluminescence. Antibodies were purchased from BD Pharmingen (anti-Bcl-2, anti-BiP, anti-poly-ADP-ribose-polymerase (PARP)) and Santa Cruz Biotechnologies (anti-Bcl-X, anti-Bax, anti-CHOP, anti-Hsp70). For chemiluminescence detection, the following horseradish peroxidase-conjugated antibodies were used: goat anti-rabbit IgG (Amersham Biosciences, Freiburg, Germany) and goat anti-mouse IgG1, IgG2a, and IgG2b (Southern Biotechnology Associates, Birmingham, AL). The murine myeloma cell line Ag8.H was treated with tunicamycin for 6 h to induce UPR activation and served as positive control for UPR-triggered proteins,20 while human Jurkat T cells, untreated or treated with 1 μM staurosporine for 6 h, were used as additional controls.
Electromobility shift analyses (EMSAs) were performed using 32P-radiolabeled double-stranded oligonucleotides with the NF-κB-binding sequence GGCCATGCCT as described previously.11 Labeled probe and nuclear protein extracts were mixed and then separated on an 8% polyacrylamide gel. The intensity of bands was quantified using a phosphoimaging instrumentation (FLA 3000 and AIDA 2D Software from Fujifilm (Agilent Technologies, Palo Alto, CA, USA)).
Flow cytometry and cell sorting
Single cell suspensions from thymus and spleen were obtained by disrupting whole organs through a 70 μm cell filter using a syringe plunger and cells were washed through the filter with RPMI medium supplemented with 5% FCS. Numbers of viable cells were determined by counting trypan blue negative cells on hemocytometers. Cells were washed once with medium and then stained in PBS containing 5% FCS (106 cells/200 μl) with fluorochrome-conjugated antibodies directed against CD4, CD8, CD25, CD44, CD24, TCRβ, CD69, B220 (CD45R), CD19, IgG, and IgM (all from BD Pharmingen). Cytofluorometric analyses were performed on a FACSCalibur (BD) and analyzed using the Cellquest Software (BD).
Cell sorting was performed using a MoFlo sorter from Dako Cytomation Corporation. Isolated fractions were re-analyzed after sorting for assuring their purity of >98%. B cells were purified either with anti-CD19-coupled magnetic beads using AutoMACS (Miltenyi Biotec, Bergisch Gladbach, Germany) or stained with anti-B220-PE (in the case of further in vitro cultures to avoid possible activation of B cells with anti-CD19) and sorted using a MoFlo cell sorter.
Caspase assays
Caspases 3 and 7 activities were measured using a luciferase-based Caspase-Glo 3/7 assay kit (Promega, Madison, WI, USA), in which cells were incubated with a DEVD-aminoluciferin substrate according to the manufacturer's instructions. A Sirius luminometer (Berthold AG, Bad Wildbad, Germany) or a 96-well plate reader Spectramax 190 (Molecular Devices Corporation, Sunnyvale, CA, US) was used for quantification of caspase activity, which is given in relative luminescence units. All samples were measured in triplicates and three serial dilutions ranging from 5 × 10⁴ to 5 × 10³ cells, respectively. Only the data using 2 × 10⁴ cells/well are shown in the Results section.
Apoptosis assays
Apoptotic and necrotic cells were identified by flow cytometric analysis according to surface binding of FITC-labeled annexin V (Responsif GmbH, Erlangen, Germany) to exposed membrane phosphatidylserine and propidium iodide (PI) staining to identify necrotic cells. Annexin V+ (AxV+)/PI− cells were regarded as ‘apoptotic,’ while AnnexinV+/PI+ cells were considered ‘necrotic’. For in vitro apoptosis induction, we used 1 μM staurosporine or 100 U/ml anti-murine Fas. Proteasome inhibitors MG132 and bortezomib were added at a concentration of 1 μg/ml.
Real-time RT-PCR
Isolation of total RNA from thymocytes or CD19+ bone marrow B cells obtained by magnetic cell separation (Miltenyi Biotec, Bergisch Gladbach, Germany) was performed using the QIAGEN mini RNAeasy kit. We used approximately 5 × 10⁶ thymocytes and 2 × 10⁶ CD19+ bone marrow B cells per sample. The obtained total RNA was digested with DNase I (Fermentas GmbH, St Leon Rot, Germany) for 30 min at 37°C. After inactivation of DNase I, cDNA was synthesized using a reverse transcriptase system from Promega (Mannheim, Germany). This cDNA was used as template for quantitative real-time PCR reactions with corresponding primers (Bax forward, TGAAGACAGGGGCCTTTTTG; Bax reverse, AATTCGCCGGAGACACTCG; IκBα forward, TGAAGGACGAGGAGTACGAGC; IκBα reverse, TTCGTGGATGATTGCCAAGTG; CHOP forward, CTGGAAGCCTGGTATGAGGAT; CHOP reverse, CAGGGTCAAGAGTAGTGAAGGT; β-actin forward, GGCTGTATTCCCCTCCATCG; β-actin reverse, CCAGTTGGTAACAATGCCATGT) and absolute qRT-PCR SYBR green ROX reagent (Abgene, Hamburg, Germany). Quantitative real-time PCR was performed in triplicates for each sample in an Applied Biosystems 7300 real-time PCR system (Applied Biosystems, Darmstadt, Germany).
Abbreviations
- BCR:
-
B-cell receptor
- CHOP:
-
C/EBP homologous protein
- ER:
-
endoplasmic reticulum
- Hsp:
-
heat shock protein
- IκB:
-
inhibitor of kappa B
- mAb:
-
monoclonal antibody
- MHC:
-
major histocompatibility complex
- NF-κB:
-
nuclear factor-kappa B
- PARP:
-
poly-ADP-ribose-polymerase
- TCR:
-
T-cell receptor
- UPR:
-
unfolded protein response
References
Ciechanover A . Intracellular protein degradation: from a vague idea thru the lysosome and the ubiquitin–proteasome system and onto human diseases and drug targeting. Cell Death Differ 2005; 12: 1178–1190.
Grimm LM, Goldberg AL, Poirier GG, Schwartz LM, Osborne BA . Proteasomes play an essential role in thymocyte apoptosis. EMBO J 1996; 15: 3835–3844.
Henderson CJ, Aleo E, Fontanini A, Maestro R, Paroni G, Brancolini C . Caspase activation and apoptosis in response to proteasome inhibitors. Cell Death Differ 2005; 12: 1240–1254.
Hideshima T, Richardson P, Chauhan D, Palombella VJ, Elliott PJ, Adams J et al. The proteasome inhibitor PS-341 inhibits growth, induces apoptosis, and overcomes drug resistance in human multiple myeloma cells. Cancer Res 2005; 61: 3071–3076.
Callahan MK, Wohlfert EA, Menoret A, Srivastava PK . Heat shock up-regulates lmp2 and lmp7 and enhances presentation of immunoproteasome-dependent epitopes. J Immunol 2006; 177: 8393–8399.
Kanaan N, Luo H, Wu J . Proteasome activity is required for T lymphocyte aggregation after mitogen activation. J Cell Biochem 2001; 81: 347–356.
Claudio E, Brown K, Siebenlist U . NF-kappaB guides the survival and differentiation of developing lymphocytes. Cell Death Differ 2006; 13: 697–701.
Mori K . Tripartite management of unfolded proteins in the endoplasmic reticulum. Cell 2000; 101: 451–454.
Servida F, Soligo D, Delia D, Henderson C, Brancolini C, Lombardi L et al. Sensitivity of human multiple myelomas and myeloid leukemias to the proteasome inhibitor I. Leukemia 2005; 19: 2324–2331.
Satou Y, Nosaka K, Koya Y, Yasunaga JI, Toyokuni S, Matsuoka M . Proteasome inhibitor, bortezomib, potently inhibits the growth of adult T-cell leukemia cells both in vivo and in vitro. Leukemia 2004; 18: 1357–1363.
Voll RE, Jimi E, Phillips RJ, Barber DF, Rincon M, Hayday AC et al. NF-kappa B activation by the pre-T cell receptor serves as a selective survival signal in T lymphocyte development. Immunity 2000; 13: 677–689.
von Boehmer H, Fehling HJ . Structure and function of the pre-T cell receptor. Annu Rev Immunol 1997; 15: 433–452.
Miosge LA, Goodnow CC . Genes, pathways and checkpoints in lymphocyte development and homeostasis. Immunol Cell Biol 2005; 83: 318–335.
Feng B, Cheng S, Pear WS, Liou HC . NF-kB inhibitor blocks B cell development at two checkpoints. Med Immunol 2004; 3: 1.
Jimi E, Phillips RJ, Rincon M, Voll R, Karasuyama H, Flavell R et al. Activation of NF-kappaB promotes the transition of large CD43+ pre-B cells to small, CD43- pre-B cells. Int Immunol 2005; 17: 815–825.
Pasparakis M, Schmidt-Supprian M, Rajewsky K . IkappaB kinase signaling is essential for maintenance of mature B cells. J Exp Med 2002; 196: 743–752.
Kaufman RJ . Orchestrating the unfolded protein response in health and disease. J Clin Invest 2002; 110: 1389–1398.
Rutkowski DT, Arnold SM, Miller CN, Wu J, Li J, Gunnison KM et al. Adaptation to ER stress is mediated by differential stabilities of pro-survival and pro-apoptotic mRNAs and proteins. PLoS Biol 2006; 4: e374.
Szegezdi E, Logue SE, Gorman AM, Samali A . Mediators of endoplasmic reticulum stress-induced apoptosis. EMBO R 2006; 7: 880–885.
Meister S, Schubert U, Neubert K, Herrmann K, Burger R, Gramatzki M et al. Extensive immunoglobulin production sensitizes myeloma cells for proteasome inhibition. Cancer Res 2007; 67: 1783–1792.
Dallaporta B, Pablo M, Maisse C, Daugas E, Loeffler M, Zamzami N et al. Proteasome activation as a critical event of thymocyte apoptosis. Cell Death Differ 2000; 7: 368–373.
Lin KI, Baraban JM, Ratan RR . Inhibition versus induction of apoptosis by proteasome inhibitors depends on concentration. Cell Death Differ 1998; 5: 577–583.
Wang X, Luo H, Chen H, Duguid W, Wu J . Role of proteasomes in T cell activation and proliferation. J Immunol 1998; 160: 788–801.
Kloetzel PM, Ossendorp F . Proteasome and peptidase function in MHC-class-I-mediated antigen presentation. Curr Opin Immunol 2004; 16: 76–81.
Adams J, Palombella VJ, Sausville EA, Johnson J, Destree A, Lazarus DD et al. Proteasome inhibitors: a novel class of potent and effective antitumor agents. Cancer Res 1999; 59: 2615–2622.
Surh CD, Sprent J . T-cell apoptosis detected in situ during positive and negative selection in the thymus. Nature 1994; 372: 100–103.
Obeng EA, Carlson LM, Gutman DM, Harrington Jr WJ, Lee KP, Boise LH . Proteasome inhibitors induce a terminal unfolded protein response in multiple myeloma cells. Blood 2006; 107: 4907–4916.
Palombella VJ, Rando OJ, Goldberg AL, Maniatis T . The ubiquitin–proteasome pathway is required for processing the NF-kappa B1 precursor protein and the activation of NF-kappa B. Cell 1994; 78: 773–785.
Blanco B, Perez-Simon JA, Sanchez-Abarca LI, Carvajal-Vergara X, Mateos J, Vidriales B et al. Bortezomib induces selective depletion of alloreactive T lymphocytes and decreases the production of Th1 cytokines. Blood 2006; 107: 3575–3583.
Ghosh S, Karin M . Missing pieces in the NF-kappaB puzzle. Cell 2002; 109 (Suppl): S81–S96.
Sunwoo JB, Chen Z, Dong G, Yeh N, Crowl Bancroft C, Sausville E et al. Novel proteasome inhibitor PS-341 inhibits activation of nuclear factor-kappa B, cell survival, tumor growth, and angiogenesis in squamous cell carcinoma. Clin Cancer Res 2001; 7: 1419–1428.
Shringarpure R, Catley L, Bhole D, Burger R, Podar K, Tai YT et al. Gene expression analysis of B-lymphoma cells resistant and sensitive to bortezomib. Br J Haematol 2006; 134: 145–156.
Park SH, Bolender N, Eisele F, Kostova Z, Takeuchi J, Coffino P et al. The cytoplasmic Hsp70 chaperone machinery subjects misfolded and endoplasmic reticulum import-incompetent proteins to degradation via the ubiquitin–proteasome system. Mol Biol Cell 2007; 18: 153–165.
Bush KT, Goldberg AL, Nigam SK . Proteasome inhibition leads to a heat-shock response, induction of endoplasmic reticulum chaperones, and thermotolerance. J Biol Chem 1997; 272: 9086–9092.
Hetz C, Bernasconi P, Fisher J, Lee AH, Bassik MC, Antonsson B et al. Proapoptotic BAX and BAK modulate the unfolded protein response by a direct interaction with IRE1alpha. Science 2006; 312: 572–576.
Johnson TR, Stone K, Nikrad M, Yeh T, Zong WX, Thompson CB et al. The proteasome inhibitor PS-341 overcomes TRAIL resistance in Bax and caspase 9-negative or Bcl-xL overexpressing cells. Oncogene 2003; 22: 4953–4963.
Wang ZQ, Stingl L, Morrison C, Jantsch M, Los M, Schulze-Osthoff K et al. PARP is important for genomic stability but dispensable in apoptosis. Genes Dev 1997; 11: 2347–2358.
Pua HH, Dzhagalov I, Chuck M, Mizushima N, He YW . A critical role for the autophagy gene Atg5 in T cell survival and proliferation. J Exp Med 2007; 204: 25–31.
Murata S, Sasaki K, Kishimoto T, Niwa S, Hayashi H, Takahama Y et al. Regulation of CD8+ T cell development by thymus-specific proteasomes. Science 2007; 316: 1349–1353.
Wils EJ, Cornelissen JJ . Thymopoiesis following allogeneic stem cell transplantation: new possibilities for improvement. Blood Rev 2005; 19: 89–98.
Acknowledgements
This work is supported by the Interdisciplinary Center for Clinical Research (IZKF, project number N2) and the German Research Society (Collaborative Research Centers SFB 643; project B3 to Reinhard Voll). Part of this work was funded by an intramural grant from the ELAN fond and the training Grant GK592 from the German Research Community (DFG). We thank especially Dr D Mielenz and B Fürnrohr for the critical reading of the paper.
Author information
Authors and Affiliations
Corresponding author
Additional information
Edited by BA Osborne
Authorship. DM and REV designed the experiments. DM, SM, and KN performed the experiments. DM collected and analyzed the data and performed the statistical analyses. DM and RV wrote the paper. SM and MH contributed to data interpretation and writing of the paper.
Supplementary Information accompanies the paper on Cell Death and Differentiation website (http://www.nature.com/cdd)
Rights and permissions
About this article
Cite this article
Maseda, D., Meister, S., Neubert, K. et al. Proteasome inhibition drastically but reversibly impairs murine lymphocyte development. Cell Death Differ 15, 600–612 (2008). https://doi.org/10.1038/sj.cdd.4402297
Received:
Revised:
Accepted:
Published:
Issue Date:
DOI: https://doi.org/10.1038/sj.cdd.4402297
Keywords
This article is cited by
-
The ESCRT protein CHMP5 escorts αβ T cells through positive selection
Cellular & Molecular Immunology (2018)
-
Post-translational control of T cell development by the ESCRT protein CHMP5
Nature Immunology (2017)
-
Plasma cells as an innovative target in autoimmune disease with renal manifestations
Nature Reviews Nephrology (2016)
-
Targeting B cells and autoantibodies in the therapy of autoimmune diseases
Seminars in Immunopathology (2014)
-
The proteasome inhibitor bortezomib depletes plasma cells and protects mice with lupus-like disease from nephritis
Nature Medicine (2008)

