Over the past 20 months, the COVID-19 pandemic has caused more than 4.9 million reported deaths (https://coronavirus.jhu.edu), and measures to limit the spread of the SARS-CoV-2 virus have affected the lives of people around the world. Although modelling has helped to reconstruct the early dynamics of the epidemic in some countries, we still lack a coherent picture of how the pandemic unfolded globally. Writing in Nature, Davis et al.1 use a worldwide model to assess early, cryptic transmission of SARS-CoV-2 — the spread of the virus that was not detected by initial surveillance efforts — in the United States and Europe.
Read the paper: Cryptic transmission of SARS-CoV-2 and the first COVID-19 wave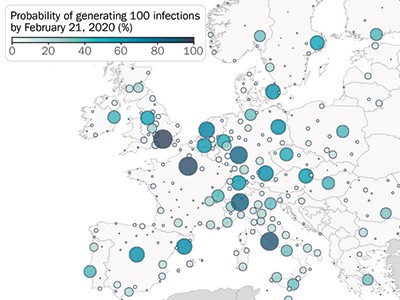
Looking back at the chronology of the first months of the pandemic, it is concerning how fast the virus spread around the world, leading to a massive shutdown of people’s social and economic lives. On 10 January 2020, 41 cases of COVID-19 were reported in Wuhan, Hubei province, China. The first reports of infection outside China were made on 13 January (in Thailand) and 16 January (in Japan). Wuhan was locked down on 23 January, followed by lockdowns in Italy (11 March), Spain (14 March), Austria (16 March) and France (17 March). Many countries, caught off-guard by the rapidly changing situation, reported a large death toll. How can we do better next time? To answer this question and improve our preparedness in the face of future pandemics, it is crucial to build a clearer picture of the initial spread of the virus. This is difficult, because the limited capacity to test for virus infections at the time meant that, in many locations, SARS-CoV-2 transmission might have been undetected.
Davis et al. used the Global Epidemic and Mobility (GLEAM) model, which has both stochastic (incorporating elements of randomness) and mechanistic (including defined principles about the biological and social mechanisms associated with viral infection and transmission) components to simulate virus spread on a global scale2. The model relies on various types of data to capture the multifactorial nature of the epidemic process. This information includes data describing: the populations in which the virus spread, such as country-specific demographics; the movement of people on international and local scales (for example, airline transport networks and commuting flows); and behaviours, such as information documenting how individuals of different ages mingle with each other. The model also captures biological aspects of SARS-CoV-2 transmission, clinical features (such as lethality for each age group analysed) and the timing of non-pharmaceutical containment measures, such as lockdowns.
Using the model, the authors shed light on how the virus propagated around the world. For example, the model confirms that, at the start (between January and March 2020), many introductions of the virus went unnoticed in both the United States and Europe (Fig. 1). In the United States, California was the first state to be affected by local transmission (week of 26 January, according to the model), even though evidence of local transmission there was reported only a month later (26 February). In Europe, modelling indicated that local transmission started at the end of January in Italy, the United Kingdom, Germany and France, again with substantial delays before local cases were reported. Overall, Davis and colleagues estimate that, by 8 March 2020, only 1–3 out of every 100 SARS-CoV-2 infections were detected in the United States and Europe.

Figure 1 | Reported and estimated numbers of cases of COVID-19 in early 2020. Davis et al.1 used a sophisticated epidemiological model to reconstruct the spread of the SARS-CoV-2 virus in 30 European countries and the United States at the beginning of the COVID-19 pandemic. They estimate that, between 17 January and 21 February 2020, only a tiny proportion of cases were detected by surveillance efforts, and that the rest of the estimated cases resulted from cryptic transmission.
Remarkably, in all 30 European countries studied and in all US states, local transmission started in a relatively narrow time window of about 2 months between mid-January and mid-March 2020. These variations in starting dates — as well as differences in the timing and strength of interventions — led to highly variable patterns of disease spread in different regions. By 4 July 2020, infection attack rates (the proportions of a region’s population that contracted the virus) ranged from around 0.2% to about 15% in the analysed regions.
The modelling can help to assess the performance of testing strategies put in place at the time, which mostly affected passengers arriving from China. Although a large proportion of individuals with COVID-19 entering the United States and Europe indeed came from China in January 2020, neighbouring European countries and US states quickly became major contributors to infection rates in the areas analysed.
The lack of robust epidemic information on international locations affected by transmissions means that the testing policies in most countries were too narrow in scope and, probably, ineffective. Davis and co-workers provide a counterfactual scenario: if testing policies had been broader, enabling the detection of 50% of all imported and local infections in the United States and Europe, the start of local transmission might have been delayed by at least a month in many places. This would have given governments more time to prepare — for example, by increasing health-care capacities and acquiring protective equipment. However, considering the optimistic underlying assumption of this counterfactual scenario, it remains difficult to imagine that countries could have scaled up their testing capacity sufficiently fast to detect 50% of all initial SARS-CoV-2 infections.
A machine-learning algorithm to target COVID testing of travellers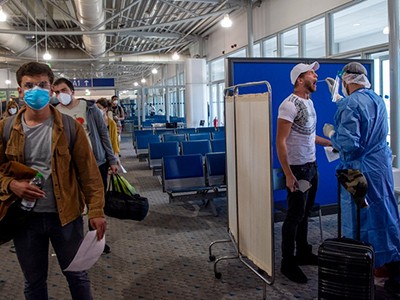
There are other methods for reconstructing the spread of SARS-CoV-2 — for example, studies that sequence the RNA of the virus to determine the ‘family tree’ of circulating strains3,4. In these approaches, the reconstructed history of viral circulation is informed by and consistent with all data available up to the time of analysis. By contrast, the simulations presented by Davis et al. are initialized to match data from the start of the pandemic, but are not constrained by what was observed after 21 January 2020. The authors therefore explore a broader range of possible trajectories of viral spread than do the phylogenetic studies, and some of these trajectories might not perfectly match what happened in reality. Despite this feature of the simulations, there is a relatively good correlation between reconstructed incidences of infections and observed numbers of cases.
Compared with other approaches, a key strength of Davis and co-workers’ approach is that their model provides a mechanistic understanding of the spread of a pandemic. This makes it possible to model scenarios that document how the pandemic might have unfolded given different policy options, such as the counterfactual scenarios mentioned above that included more-intensive testing from the start of the pandemic. This capacity of models to capture and anticipate complex nonlinear dynamics and assess the potential effects of different policy options explains in large part why such modelling has increasingly been used to support policymaking, and this trend has been amplified by the pandemic. The creation of a Center for Disease Forecasting by the US Centers for Disease Control and Prevention is only the most recent example of this trend5.
Several exciting avenues should be considered for improving these models for future use. Methods that calibrate these models to both epidemiological and virus-sequencing data could improve their performance for ‘now-casting’ and forecasting viral spread, as well as for assessing the effects of policies in real time. A more detailed understanding of the factors affecting spread (such as mobility, mixing patterns, behavioural changes, climate and population immunity) is necessary to improve model assumptions. Models are only as good as the data they rely on. Although COVID-19 surveillance and related data sets have considerably improved during the pandemic, these efforts must be maintained beyond COVID-19, and stable information systems6,7 (for example, https://coronavirus.jhu.edu) must continue to be made available to assess global disease dynamics in a robust manner.
 Read the paper: Cryptic transmission of SARS-CoV-2 and the first COVID-19 wave
 Contact-tracing app curbed the spread of COVID in England and Wales
 A machine-learning algorithm to target COVID testing of travellers