
Abstract
Technical trading represents a class of investment strategies for Financial Markets based on the analysis of trends and recurrent patterns in price time series. According standard economical theories these strategies should not be used because they cannot be profitable. On the contrary, it is well-known that technical traders exist and operate on different time scales. In this paper we investigate if technical trading produces detectable signals in price time series and if some kind of memory effects are introduced in the price dynamics. In particular, we focus on a specific figure called supports and resistances. We first develop a criterion to detect the potential values of supports and resistances. Then we show that memory effects in the price dynamics are associated to these selected values. In fact we show that prices more likely re-bounce than cross these values. Such an effect is a quantitative evidence of the so-called self-fulfilling prophecy, that is the self-reinforcement of agents' belief and sentiment about future stock prices' behavior.
Introduction
Physical and mathematical methods derived from Complex Systems Theory and Statistical Physics have been shown to be effective tools1,2,3,4 to provide a quantitative description and an explanation of many social5,6,7 and economical phenomena8,9,10,11.
In the last two decades Financial Markets have appeared as natural candidates for this inter-disciplinary application of methods deriving from Physics because a systematic approach to the issues set by this field can be undertaken. In fact since twenty years there exists a huge amount of high frequency data from stock exchanges which permit to perform experimental analyses as in Natural Sciences. Therefore Financial Markets appear as a good playground where models and theories can be tested. In addition the methods of Physics have proved to be very effective in this field and have often given rise to concrete financial applications.
The major contributions of Physics to the comprehension of Financial Markets are focused on one hand on the analysis of financial time series' properties and on the other hand on agent-based modeling12,13. The former contribution provides fundamental insights in the non trivial nature of the stochastic process performed by stock prices14,15,16,17,18 and in the role of the dynamic interplay between agents in the explanation of the behavior of the order impact on prices15,19,20,21,22,23,24. The latter approach instead has tried to overcome the traditional economical models based on concepts like price equilibrium and homogeneity of agents in order to investigate the role of heterogeneity of agents and strategies with respect to the price dynamics13,25,26,27,28,29,30,31,32,33.
In this paper we focus our attention on a puzzling issue which can be put halfway between these two approaches: technical trading. According to the standard economical theory of Financial Markets the strategies based on the analysis of trends and recurrent patterns (known indeed as technical trading or chartist strategies) should not be used if all agents were rational because prices should follow their fundamental values34,35 and no exploitation opportunities should be present36. Consequently these speculative strategies cannot be profitable in such a scenario.
It is instead well-known that chartists (i.e. technical traders) exist and operate on different time scales ranging from seconds to months. Technical analysis has been widely used and studied over the years. A comprehensive and recent review of the most important results about the existence of technical signals and their profitability is the one of Park and Irwin37. They stress the existence of a number of problems in performing such studies and the consequent presence of mixed conclusions. Here we quickly summarizes some of these studies.
Since the pioneering work of Smidt38 several studies have proved the widespread use of technical analysis among traders (for a recent survey, see39). Despite this evidence, the academic world has remained quite skeptical because of the acceptance of the efficient market hypothesis36 and the negative results found in early studies. More recently, a renewed interest for technical analysis led to various papers. Here we will mainly consider the ones regarding the specific techniques we are going to study in this paper, supports and resistances, which are the tendency to bounce on specific price values. Some of the most striking and seminal results have been obtained by Brock et al.40. They showed a positive correspondence between the presence of supports and resistance and the following returns. However, they did not consider transaction costs, so the profitability issue was missing. Sullivan et al.41 studied a huge sets of trading rules, finding that, typically, the best rule inside a sample does not generate a profit in the following years. This has been interpreted as an evidence for an evolution of markets towards a more efficient state. Finally, we cite Osler42 who took into account the connection between supports and resistances and price clustering, that is, the tendency agents have to place orders at round prices.
As far as we know, the econophysics community did not address the supports and resistance issue in a direct way. However, some studies can be reinterpreted in this perspective. For example, Preis et al.43 extensively studied trend switches at different time scales, finding evidences for an universal, scale free behavior of transaction volume and intertrade times and in Ref. 44 evidence is provided that financial high frequency patterns tend to repeat themselves. See also45 for an extensive review. In a series of papers (see for example46), Sornette and coauthors have proposed a log-periodic power law as an empirical fit in order to predict financial crashes. This approach has been widely discussed; however we do not believe this is the place where this debate should be addressed, also because we will take into account much shorter time scales.
In this paper we investigate if this specific chartist strategy produces a measurable effect on the statistical properties of price time series that is if there exist special values on which prices tend to bounce. As we are going to see, the first task that we must address consists in the formalization of this strategy in a suitable mathematical framework.
Once a quantitative criterion to select potential supports and resistances is developed, we investigate if these selected values introduce memory effects in price evolution.
We observe that: i) the probability of re-bouncing on these selected values is higher than what expected and ii) the more the number of bounces on these values increases, the higher is the probability of bouncing again on them. In terms of agents' sentiment we can say that the more agents observe bounces the more they expect that the price will again bounce on that value and their beliefs introduce a positive feedback which in turn reinforces the support or the resistance.
The classical and the technical approaches
The classical approach in the study of the market dynamics is to build a stochastic model for the price dynamics with the so called martingale property E(xt+1|xt, xt−1, …, x0) = xt ∀t47,48,49,50. The use of a martingale for the description of the price dynamics naturally arises from the efficient market hypothesis and from the empirical evidence of the absence of simple autocorrelation between price increments (i.e. returns). The consequence of this kind of model for the price is that it is impossible to extract any information on the future price movements from an analysis of the past variations.
On the contrary, technical analysis is the study of the market behavior underpinned on the inspection of the price graphs, with the aim to speculate on the future value of prices. According to the technical approach, the analysis of the past prices can lead to the forecast of the future value of prices. This approach is based upon three basic assumptions51:
-
the market discounts everything: the price reflects all the possible causes of the price movements (investors' psychology, political contingencies and so on) so the price graph is the only tool to be considered in order to make a prevision.
-
price moves in trends: the price moves as a part of a trend, which can have three directions: up, down, sideways. According to the technical approach, a trend is more likely to continue than to stop. The ultimate goal of the technical analysis is to spot a trend in its early stage and to exploit it by investing in its direction.
-
history repeats itself: Thousands of price graphs of the past have been analyzed and some figures (or patterns) of the price graphs have been linked to an upward or downward trend51. The technical analysis argues that a price trend reflects the market psychology. The hypothesis of the technical analysis is that if these patterns anticipated a specific trend in the past they would do the same in the future. As the psychology of the investors do not change over time, an investor would always react in the same way when he undergoes the same conditions.
One reason for the technical analysis to work could be the existence of a feedback effect called self-fulfilling prophecy. Financial markets have a unique feature: the study of the market affects the market itself because the results of studies on it will be probably used in the decision processes by the investors (other disciplines, such as physics, do not have to face this issue). The spread of the technical analysis entails that a large number of investors have become familiar with the use of the so called figures. A figure is a specific pattern of the price associated to a future bullish or bearish trend. Therefore, it is believed that a large amount of money have been moved in reply to bullish or bearish figures causing price changes. In a market, if a large number of investors has the same expectations on the future value of the price and they react in the same way to this expectation they will operate in such a way to fulfill their own expectations. As a consequence, the theories that predicted those expectation will gain investors' trust triggering a positive feedback loop. In this paper we tried to measure quantitatively the trust on one of the figures of technical analysis.
Supports and resistances
Let us now describe a particular figure: supports and resistances. The definition of support and resistance of the technical analysis is rather qualitative: a support is a price level, local minimum of the price, where the price will bounce on other times afterward while a resistance is a price level, local maximum of the price, where the price will bounce on other times afterward. We expect that when a substantial number of investors detect a support or a resistance the probability that the price bounces on the support or resistance level is larger than the probability the price crosses the support or resistance level. Whether the investors regard a local minimum or maximum as a support or a resistance or not can be related to: i) the number of previous bounces on a given price level, ii) the time scale. The investors could a priori look at heterogeneous time scales. This introduces two parameters which we allow to vary during the analysis in order to understand if and how they affect our results.
Results
Empirical evidence of memory effects
The analyses presented in this paper are carried out on the high frequency (tick-by-tick i.e. we have a record of the price for every operation), time series of the price of 9 stocks of the London Stock Exchange in 2002 (251 trading days). The analyzed stocks are: AstraZeNeca (AZN), British Petroleum (BP), GlaxoSmithKline (GSK), Heritage Financial Group (HBOS), Royal Bank of Scotland Group (RBS), Rio Tinto (RIO), Royal Dutch Shell (SHEL), Unilever (ULVR), Vodafone Group (VOD).
The price of these stocks is measured in ticks. A tick is the minimum change of the price. The time is measured in seconds. We choose to adopt the physical time because we believe that investors perceive this one. We checked that the results are different as we analyze the data with the time in ticks or in seconds. A measure of the time in ticks would make difficult to compare and aggregate the results for different stocks. In fact, while the physical time of trading does not change from stock to stock the number of operations per day can be very different.
We measure the conditional probability of a bounce p(b|bprev) given bprev previous bounces. This is the probability that the price bounces on a local maximum or minimum given bprev previous bounces. Practically, we record if the price, when is within the stripe of a support or resistance, bounces or crosses it for every day of trading and for every stock. We assume that all the supports or resistances detected in different days of the considered year are statistically equal. As a result we obtain the bounce frequency  for the total year (where N is the total number of events for a specific number of previous bounces). Now we can estimate p(b|bprev) with the method of the Bayesian inference52,53: we infer p(b|bprev) from the number of bounces
  and from the total number of trials N assuming that
  is a realization of a Bernoulli process because when the price is contained into the stripe of a previous local minimum or maximum it can only bounce on it or cross it (see Supporting Information for further details on the modeling of bounce events).
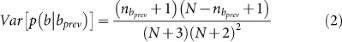
Using this framework we can evaluate the expected value and the variance of p(b|bprev) using the Bayes theorem (see Supporting Information for mathematical details of the derivation)

In fig. 1 and fig. 2 the conditional probabilities are shown for different time scales. The data of the stocks have been compared to the time series of the shuffled returns of the price. In this way we can compare the stock data with a time series with the same statistical properties but without any memory effect. As shown in the graphs, the probabilities of bounce of the shuffled time series are nearly 1 = 2 while the probabilities of bounce of the stock data are well above 1 = 2. For the shuffled series the probability is in almost all cases larger than 1 = 2, this small bias towards a value larger than 1 = 2 is due to the finiteness of the stripe. A similar bias would be observed also for a series generated by a Random-Walk. However, we observe that this is intrinsic asymmetry is at least one order of magnitude smaller than the effect measured in the non-shuffled case. In addition to this, it is noticeable that the probability of bounce rises up as bprev increases. Conversely, the probability of bounce of the shuffled time series is nearly constant. The increase of p(b|bprev) of the stocks with bprev can be interpreted as the growth of the investors' trust on the support or the resistance as the number of bounces grows. The more the number of previous bounces on a certain price level the stronger the trust that the support or the resistance cannot be broken soon. As we outlined above, a feedback effect holds and an increase of the investors' trust on a support or a resistance entails a decrease of the probability of crossing that level of price.

Graphs of the conditional probability of bounce on a resistance/support given the occurrence of bprev previous bounces.
Time scales: T = 45 (panel (a) and (c)) and 60 seconds (panel (b) and (d)). The data are obtained aggregating the result of the 9 stocks considered. The data of the stocks are shown as red circles while the data of the time series of the shuffled returns of the price are shown as black circles. The graphs in the left refer to the resistances while the ones on the right refer to the supports.

Graphs of the conditional probability of bounce on a resistance/support given the occurrence of bprev previous bounces.
Time scales: T = 90 (panel (a) and (c)) and 180 seconds (panel (b) and (d)). The data are obtained aggregating the result of the 9 stocks considered. The data of the stocks are shown as red circles while the data of the time series of the shuffled returns of the price are shown as black circles. The graphs in the left refer to the resistances while the ones on the right refer to the supports.
We have performed a χ2 test to verify if the hypothesis of growth of p(b|bprev) is statistically meaningful. The independence test (p(b|bprev) = c) is performed both on the stock data and on the data of the shuffled time series and we compute

Then we compute the p-value associated to a χ2 distribution with 3 degrees of freedom. We choose a significance level  . If
. If  the independence hypothesis is rejected while if
  it is accepted. The results are shown in table 1. The results show that there is a clear increase of the investors' memory on the supports/resistances as the number of previous bounces increases for the time scales of 45, 60 and 90 seconds. Conversely, this memory do not increase from the statistical significancy point of view at the time scale of 180 seconds.
As a further proof of the statistical significance of the memory effect observed, we perform a Kolmogorov-Smirnov test (see Ref. 54) in order to assess whether the bounce frequencies estimated from the reshuffled series are compatible with the posterior distribution found for bounce frequency. We indeed find that reshuffled events are statistically different from empirical values (details on the implementation of the Kolmogorov-Smirnov test are discussed in Supporting Information).
We consider the slope of the weighted linear fit of p(b|bprev) (shown in figures 1 and 2) at different time scales in order to study how the memory effect changes with the time scale considered. The slopes are shown in fig. 3, resistances in the left graph, supports in the right graph. The best fit lines of p(b|bprev) are always upward sloping and decrease as the time scale increases. There are differences between resistances and supports as far as higher timescales are concerned. In particular, the slopes relative to the resistances decay slower that the slopes relative to the supports. While the former are statistically different from 0 on all time scale investigated the latter tends to 0 for scales above 150 s.

Graphs of the slope of the best fit line of p(b|bprev) at different time scales ranging from 1 to 180 s in the case of resistances (panel (a)) and supports (panel (b)).
The slopes of the original data are compared with the slopes of the shuffled data.
In summary this analysis shows that the memory effect decreases as the time scale increases. We find that it disappears at the time scale larger than 180 s–180 s is the maximum scale we investigate – for resistances and 150 s for supports.
Distribution of local minima/maxima
We study the distribution of supports and resistances in order to assess whether the price is more likely to bounce on some particular levels rather than on others. It is possible in principle that round values of the price (e.g. 100 £) are favored levels for psychological reasons. We produced a histogram of the local maxima/minima for every stock and time scale. The histogram of the local minima relative to VOD at the time scale of 60 seconds is shown in fig. 4 as an example. We find no evidence of highly preferred prices in any of the histograms produced. As a further proof, we also compare in that figure the histogram of support and resistance levels with the price level histogram and we do not observe any anomaly.

Histogram of the resistance price levels (panel (a)) and supports (panel (b)) of VOD for the 251 trading days of 2002 for the time scale 60 s.
Both resistance and support levels are compared with the histogram of price levels for this time scale. We do not observe significant excess around round numbers or anomalies with respect to the histogram of the price levels. We find similar results, i.e. absence of anomalies in the histogram for supports and resistances, for all stocks and all time scales investigated.
Long memory of the price and antipersistency
The analysis of the conditional probability p(b|bprev) proves the existence of a long memory in the price time series.
However, it is a well-known results that stock prices exhibit deviations from a purely diffusion especially at short time scales. We indeed find that the mean of the Hurst exponent 〈H〉 is always less than the value of 0.5 and therefore there is an anticorrelation effect of the price increments for the 9 stocks analyzed. The Hurst exponent is estimated via the detrended fluctuation method55,56. It is useful to recall what the Hurst exponent provides about the autocorrelation of the time series:
-
if H < 0.5 one has negative correlation and antipersistent behavior
-
if H = 0.5 one has no correlation
-
if H > 0.5 one has positive correlation and persistent behavior
Therefore the anticorrelation of the price increments might lead to an increase of the bounces and therefore it could mimic a memory of the price on a support or resistance. We perform an analysis of the bounces on a antipersistent fractional random walk to verify if the memory effect depends on the antipersistent nature of the price in the time scale of the day. We choose a fractional random walk with the Hurst exponent H = 〈Hstock〉 = 0.44 given by the average over the H exponents of the different stocks. The result is shown in fig. 5. The conditional probabilities p(b|bprev) are very close to 0.5 and it is clear that p(b|bprev) is almost constant as expected. These two results prove that the memory effect of the price does not depend on its antipersistent features, or at least the antipersistency is not able to explain the pattern observed in figs. 1 and 2.

Graph of the conditional probability of bounce on a resistance/support given the occurrence of bprev previous bounces for a fractional random walk (we used the average daily Hurst exponent equal to 0.44).
The red circles refers to supports, the black ones to resistances. The persistency deriving from a Hurst exponent smaller than 0.5 is not able to explain the probability of bounce observed in Figs. 1 and 2.
Features of the bounces
In this section we want to describe two statistical features of the bounces as a sort of Stylized Facts of these two figures of technical trading techniques: the time τ occurring between two consecutive bounces and the maximum distance δ of the price from the support or the resistance between two consecutive bounces.
The time of recurrence τ is defined as the time between an exit of the price from the stripe centered on the support or resistance and the return of the price in the same stripe, as shown in fig. 6 panel a. We study the distribution of τ for different time scales (45, 60, 90 and 180 seconds). We point out that, being τ measured in terms of the considered time scale, we can compare the four histograms. We find that a power law fit describes well the histograms of τ and, as an example, in fig. 6 panel b we report the histogram for the time scale 60 seconds.

Statistical features of bounces.
Panel (a): Sketch of the price showing how we defined τ, the time between two bounces and δ, the maximum distance between the price and the support or resistance level between two bounces. Panel (b) Histogram for τ at the time scales of 60 seconds. We obtain the histograms aggregating the data from all the 9 stocks analyzed. We do not make any difference between supports and resistances in this analysis. The histogram of τ is well-fitted by a power law at all time scales. The exponent results to be dependent on the time scale considered. In this specific case (60 seconds) we find N ~ τ−0.56. Panel (c) Histogram of δ at the time scale of 60 seconds. As in the previous panel, we obtain the histograms by aggregating the data from all the 9 stocks. We do not make any difference between supports and resistances in this analysis. The price difference δ is measured in price ticks. Differently from the previous case we find that the decay is compatible with an exponentially truncated power law at all time scales. In this specific case (60 seconds) we find N ~ δ−0.61 exp(−0.03 δ).
We instead call δ the maximum distance reached by the price before the next bounce. We show in fig. 6 panel a, how the maximum distance δ is defined. We study the distribution of δ for different time scales (45, 60, 90 and 180 seconds). In this case a power law fit does not describe accurately the histogram of δ and instead the behavior appears to be compatible at all scales with an exponentially truncated power law as shown in Fig. 6 panel c.
Discussion
In this paper we perform a statistical analysis of the price dynamics of several stocks traded at the London Stock Exchange in order to verify if there exists an empirical and detectable evidence for technical trading. In fact it is known that there exist investors which use technical analysis as trading strategy (also known as chartists). The actions of this type of agents may introduce a feedback effect, the so called self-fulfilling prophecy, which can lead to detectable signals and in some cases to exploitation opportunities, in details, these feedbacks can introduce some memory effects on the price evolution. The main goal of this paper is to determine if such memory in price dynamics exists or not and consequently if it it possible to quantify the feedback on the price dynamics deriving from some types of technical trading strategies. In particular we focus our attention on a particular figure of the technical analysis called supports and resistances. In order to estimate the impact on the price dynamics of such a strategy we measure the conditional probability of the bounces p(b|bprev) given bprev previous bounces on a set of suitably selected price values to quantify the memory introduced by the supports and resistances.
We find that the probability of bouncing on support and resistance values is higher than 1 = 2 or, anyway, is higher than an equivalent random walk or of the shuffled series. In particular we find that as the number of bounces on these values increases, the probability of bouncing on them becomes higher. This means that the probability of bouncing on a support or a resistance is an increasing function of the number of previous bounces, differently from a random walk or from the shuffled time series in which this probability is independent on the number of previous bounces. This features is a very interesting quantitative evidence for a self-reinforcement of agents' beliefs, in this case, of the strength of the resistance/support.
As a side result we also develop a criterion to select the price values that can be potential supports or resistances on which the probability of the bounces p(b|bprev) is measured.
We point out that this finding may be, in principle, an exploitation opportunity because, once the support or the resistance is detected, the next time the price will be in the nearby of the value a re-bounce will be more likely than the crossing of the resistance/support. In future works we plan to verify if the predictability of the direction of the price movements around a support/resistance can lead to real exploitation once transaction costs, frictions (i.e. the delay between order submissions and executions) and liquidity effects are taken into account.
Methods
Supports and Resistances: quantitative definition
One has to face two issues to build a quantitative definition of support and resistance: the time scale and the width of the bounces.
-
We define a bounce of the price on a support/resistance level as the event of a future price entering in a stripe centered on the support/resistance and exiting from the stripe without crossing it. Furthermore, we want to develop a quantitative definition compatible with the way the investors use to spot the support/resistances in the price graphs. In fact the assumed memory effect of the price stems from the visual inspection of the graphs that comes before an investment decision. To clarify this point let us consider the three price graphs in fig. 7. The graph in the top panel shows the price tick-by-tick of British Petroleum in the 18th trading day of 2002. If we look to the price at the time scale of the blue circle we can state that there are two bounces on a resistance, neglecting the price fluctuations at minor time scales. Conversely, if we look to the price at the time scale of the red circle we can state that there are three bounces on a resistance, neglecting the price fluctuation at greater time scales. The bare eye distinguishes between bounces at different time scales, which have to be analyzed separately. To select the time scale to be used for the analysis of the bounces, we considered the time series PT(ti) obtained picking out a price every T ticks from the time series. The obtained time series is a subset of the original one: if the latter has L terms then the former has [L/T] terms (the square brackets [ ] indicate the floor function defined as
 ). In this way we can remove the information on the price fluctuations for time scales smaller than T. The two graphs in fig. 7 (bottom panel) show the price time series obtained from the tick-by-tick recordings respectively every 50 and 10 ticks. We can see that the blue graph on the left shows only the bounces at the greater time scale (the time scale of the blue circle) as the price fluctuations at the minor time scale (the one of the red circle) are absent. Conversely these price fluctuations at the minor time scale are evident in the red graph on the right.
 Figure 7 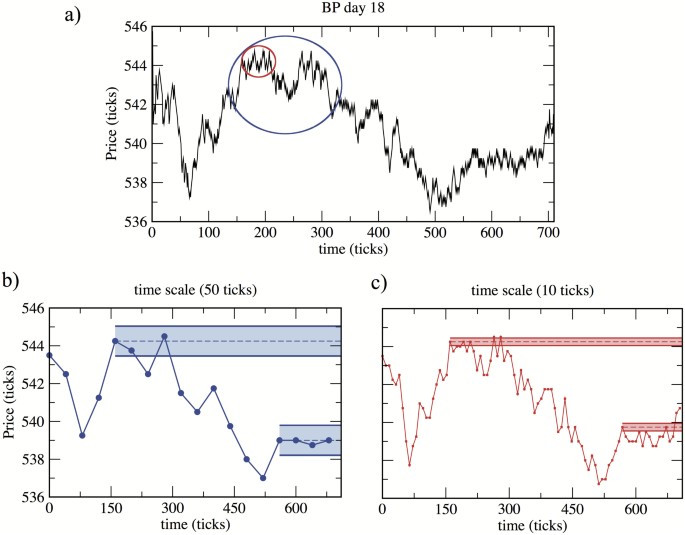
The graph above illustrates the price (panel (a)) tick-by-tick of the stock British Petroleum in the 18th trading day of 2002.
The blue and red circles define two regions of different size where we want to look for supports and resistances. Panel (b) shows the price (in blue) extracted from the time series tick-by-tick picking out a price every 50 ticks in the same trading day of the same stock. Panel (c) shows the price (in red) extracted from the time series tick-by-tick picking out a price every 10 ticks. The horizontal lines represent the stripes of the resistances to be analyzed.
-
The width Δ of the stripe centered on the support or resistance at the time scale T is defined as
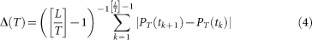
that is the average of the absolute value of the price increments at time scale T. Therefore Δ depends on both the trading day and the time scale and it generally rises as T does. In fact it approximately holds that Δ(T) ~ Tα where α is the diffusion exponent of the price in the day considered. The width of the stripe represents the tolerance of the investors on a given support or resistance: if the price drops below this threshold the investors regard the support or resistance as broken.
 ). In this way we can remove the information on the price fluctuations for time scales smaller than T. The two graphs in

To sum up, we try to separate the analysis of the bounces of price on supports and resistances for different time scales. Provided this quantitative definition of support and resistance in term of bounces we perform an analysis of the bounces in order to determine if there is a memory effect on the price dynamics on the previous bounces and if this effect is statistically meaningful.
References
Golub, T. Counterpoint: Data first. Nature 464, 679 (2010).
Mitchell, T. Mining Our Reality. Science 326, 1644–1645 (2009).
Vespignani, A. Predicting the Behavior of Techno-Social Systems. Science 325, 425–428 (2009).
Lazer, D. et al. Computational Social Science. Science 323, 721–23 (2009).
Goel, S., Hofman, J., Lahaie, S., Pennock, D. & Watts, D. Predicting consumer behavior with Web search. PNAS 107, 17486 (2010).
Golder, S. & Macy, M. Diurnal and Seasonal Mood Vary with Work, Sleep and Daylength Across Diverse Cultures. Science 333, 1878–1881 (2011).
Ginzberg, J. et al. Detecting influenza epidemics using search engine query data. Nature 457, 1012–1014 (2009).
Choi, H. & Varian, H. Predicting the Present with Google Trends. http://static.googleusercontent.com/external_content/untrusted_dlcp/www.google.com/it//googleblogs/pdfs/google_predicting_the_present.pdf (2009)Accessed November 12, 2013.
Bordino, I. et al. Web Search Queries Can Predict Stock Market Volumes. PLOS ONE 7, e40014; 10.1371/journal.pone.0040014 (2009).
Saavedra, S., Hagerty, K. & Uzzi, B. Synchronicity, instant messaging and performance among financial traders. PNAS 108, 5296–5301 (2011).
Preis, T., Reith, D. & Stanley, H. E. Complex dynamics of our economic life on different scales: insights from search engine query data. Philos Transact A Math Phys Eng Sci. 386, 5707–5719 (2010).
Chakraborti, A., Toke, I. M., Patriarca, M. & Abergel, F. Econophysics Review: I. Empirical facts. Quant. Financ. 11, 991–1012 (2011).
Cristelli, M., Zaccaria, A. & Pietronero, L. [Critical overview of Agent-Based Models]. Complex Materials in Physics and Biology [Mallamace F., & Stanley H. E. (eds.)] [235–282] (IOS Press, 2011).
Bouchaud, J.-P., Farmer, J. D. & Lillo, F. [How Markets Slowly Digest Changes in Supply and Demand]. Handbook of Financial Markets: Dynamics and Evolution [57–160] (Elsevier: Academic Press, 2009).
Bouchaud, J.-P., Mezard, M. & Potters, M. Statistical Properties of Stock Order Books: Empirical Results and Models. Quant. Financ. 2, 251–256 (2002).
Lillo, F. & Farmer, J. The Long Memory of the Efficient Market. Stud. Nonlinear Dyn. E. 8, Article 1 (2004).
Laloux, L., Cizeau, P., Bouchaud, J.-P. & Potters, M. Noise Dressing of Financial Correlation Matrices. Phys. Rev. Lett. 83, 1467 (1999).
Laloux, L., Cizeau, P., Bouchaud, J.-P. & Potters, M. Random matrix theory and financial correlations. Int. J. Theor. Appl. Finance 3, 391 (2000).
Potters, M. & Bouchaud, J.-P. More statistical properties of order books and price impact. Physica A, 324, 133–140 (2003).
Wyart, M., Bouchaud, J.-P., Kockelkoren, J., Potters, M. & Vettorazzo, M. Relation between bidask spread, impact and volatility in order-driven markets. Quant. Financ. 8, 41–57 (2008).
Lillo, F., Farmer, J. D. & Mantegna, R. N. Master curve for price-impact function. Nature, 421, 129–130 (2003).
Farmer, J. D., Gillemot, L., Lillo, F., Mike, S. & Sen, A. What really causes large price changes? Quant. Financ. 4, 383–397 (2004).
Weber, P. & Rosenow, B. Large stock price changes: Volume or liquidity? Quant. Financ. 6, 7–14 (2006).
Cristelli, M., Alfi, V., Pietronero, L. & Zaccaria, A. Liquidity crisis, granularity of the order book and price fluctuations. Eur. Phys. J. B 73, 41–49 (2010).
Alfi, V., Cristelli, M., Pietronero, L. & Zaccaria, A. Mechanisms of Self-Organization and Finite Size Effects in a Minimal Agent Based Model. J. Stat. Mech. P03016 (2009).
Samanidou, E., Zschischang, E., Stauffer, D. & Lux, T. Agent-based models of financial markets. Rep. Prog. Phys. 70, 409 (2007).
Lux, T. & Marchesi, M. Scaling and criticality in a stochastic multi-agent model of a financial market. Nature, 397, 498–500 (1999).
Giardina, I. & Bouchaud, J.-P. Bubbles, crashes and intermittency in agent based market models. Eur. Phys. J. B 31, 421–437 (2003).
Caldarelli, G., Marsili, M. & Zhang, Y.-C. A prototype model of stock exchange. Europhys. Lett. 40, 479–484 (1997).
Alfi, V., Pietronero, L. & Zaccaria, A. Self-organization for the stylized facts and finite-size effects in a financial-market model. Europhys. Lett. 86, 58003 (2009).
Alfi, V., Cristelli, M., Pietronero, L. & Zaccaria, A. Minimal Agent Based Model for Financial Markets I: Origin and Self-Organization of Stylized Facts. Eur. Phys. J. B 67, 385–397 (2009).
Alfi, V., Cristelli, M., Pietronero, L. & Zaccaria, A. Minimal Agent Based Model for Financial Markets II: Statistical Properties of the Linear and Multiplicative Dynamics. Eur. Phys. J. B 67, 399–417 (2009).
Alanyali, M., Moat, S. M. & Preis, T. Quantifying the Relationship Between Financial News and the Stock Market. Sci. Rep. 3, 3578; 10.1038/srep03578 (2013).
Buchanan, M. Why economic theory is out of whack. New Sci. 2665, 32–35 (2008).
Kreps, D. M. A course in microeconomic theory (Princeton University Press, 1990).
Fama, E. F. Efficient Capital Markets: A Review of Theory and Empirical Work. J. Finance 25, 383–417 (1970).
Park, C.-H. & Irwin, S. H. What Do We Know About the Profitability of Technical Analysis? J. Econ. Surv. 21, 786–826 (2007).
Smidt, S. Amateur speculators (Ithaca, NY: Graduate School of Business and Public Administration Cornell University, 1965).
Menkhoff, L. The use of technical analysis by fund managers: International evidence. J. Bank Financ. 34, 2573–2586 (2010).
Brock, W., Lakonishok, J. & LeBaron, B. Simple Technical Trading Rules and the Stochastic Properties of Stock Returns. J. Finance 47, 1731–1767 (1992).
Sullivan, R., Timmermann, A. & White, H. Forecast evaluation with shared data sets. Int. J. Forecasting 19, 217–227 (2003).
Osler, C. L. Currency Orders and Exchange Rate Dynamics: An Explanation for the Predictive Success of Technical Analysis. J. Finance 58, 1791–1820 (2003).
Preis, T., Schneider, J. J. & Stanley, H. E. Switching processes in financial markets. PNAS 108, 7674–7678 (2011).
Preis, T., Paul, W. J. & Schneider, J. J. Fluctuation patterns in high-frequency financial asset returns. Europhys. Lett. 82, 68005 (2008).
Preis, T. GPU-computing in econophysics and statistical physics. Eur. Phys. J.-Spec. Top. 194, 5–86 (2011).
Sornette, D., Woodard, R. & Zhou, W.-X. Oil Bubble: evidence of speculation and prediction. Physica A 388, 1571–1576 (2009).
Hull, J. C. Options, Futures and Other Derivatives (Prentice Hall, 2002).
Bouchaud, J. P. & Potters, M. Theory of Financial Risk and Derivative Pricing (Cambridge university press, 2003).
Voit, J. The Statistical Mechanics of Financial Markets (Springer, 2005).
Mantegna, R. N. & Stanley, H. E. An Introduction to Econophysics (Cambridge university press, 2000).
Murphy, J. J. Technical Analysis of the Financial Markets (New York institute of Finance, 1999).
Feller, W. An Introduction to Probability Theory and Its Applications (Wiley 3th edition, 1968).
D'Agostini, G. Bayesian reasoning in data analysis. A critical introduction (World Scientific Publishing, 2003).
Smirnov, N. Table for estimating the goodness of fit of empirical distributions. Ann. Math. Stat. 19, 279–281 (1948).
Peng, C.-K. et al. Mosaic Organization of DNA Nucleotides. Phys. Rev. E 49, 1685–1689 (1994).
Peng, C. K., Havlin, S., Stanley, H. E. & Goldberger, A. L. Quantification of Scaling Exponents and Crossover Phenomena in Nonstationary Heartbeat Time Series. CHAOS 5, 82 (2005).
Acknowledgements
This work was supported by Italian PNR project CRISIS-Lab. We thank Diego Fiorani for providing the data and Andrea Tacchella for useful discussion about generating fractional random walks.
Author information
Authors and Affiliations
Contributions
M.C., A.Z. and L.P. developed the logic for these ideas, F.G. explored the data and M.C., A.Z., F.G. and G.P. developed the formal and statistical analysis. All authors were involved in writing the paper.
Ethics declarations
Competing interests
The authors declare no competing financial interests.
Electronic supplementary material
Supplementary Information
Supporting Information
Rights and permissions
This work is licensed under a Creative Commons Attribution-NonCommercial- ShareALike 3.0 Unported License. To view a copy of this license, visit http://creativecommons.org/licenses/by-nc-sa/3.0/
About this article
Cite this article
Garzarelli, F., Cristelli, M., Pompa, G. et al. Memory effects in stock price dynamics: evidences of technical trading. Sci Rep 4, 4487 (2014). https://doi.org/10.1038/srep04487
Received:
Accepted:
Published:
DOI: https://doi.org/10.1038/srep04487
This article is cited by
-
A Hybrid Spectral-Finite Difference Method for Numerical Pricing of Time-Fractional Black–Scholes Equation
Computational Economics (2023)
-
A robust numerical solution to a time-fractional Black–Scholes equation
Advances in Difference Equations (2021)
Comments
By submitting a comment you agree to abide by our Terms and Community Guidelines. If you find something abusive or that does not comply with our terms or guidelines please flag it as inappropriate.
