
Lesson 5: Earthquake Machine
As concluded in Lesson 4, earthquakes are associated with displacements on faults. Faults lock and a displacement occurs when the stress across the fault builds up to a sufficient level to cause rupture of the fault. This is known as stick-slip motion or behavior. In this lesson, students observe and understand how stick-slip motion occurs along faults by building a simple model of a fault system.
Caution: Stick-slip motion should not be confused with strike-slip motions along lateral faults. This activity is designed for two 1-hour class periods or one 2-hour lab period.
This lesson is adapted from a lesson published by:
Hubenthal, M., Braile, L., & Taber, J. Redefining earthquakes and the earthquake machine. The Science Teacher 75, 32–36 (2008).
Materials
-
Two 4" x 4" wooden blocks
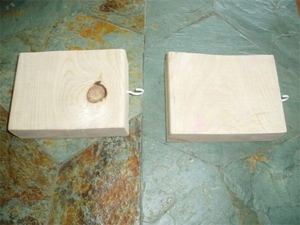 Figure 1: Wooden blocks with screw
 - Two screw eyes, 12 x 1–3/16"
- One 4" x 36" sanding belt (50 Grit)
- One 1/3 sheet of sandpaper (60 Grit)
- One rubber band
- 16" of duct tape
- One fabric tape measurement
- One pair of scissors
- One hot glue gun
Note: The above materials are enough for building one model. It is encouraged to divide your students into groups of five and provide each group with the above materials so that they can build their own models. To reduce the cost of the materials, you may choose to build only one model for your students and have each student try the model.
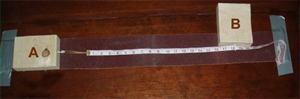
Figure 2: Final model — sandpaper is glued only to the bottom of block A
Introduction
1. Ask a student to summarize lessons learned from Lesson 4. Make sure students understand the relationship between faults and earthquakes (i.e., when a fault ruptures, the stored energy in surrounding rocks is released and an earthquake occurs).
2. Remind students that movement along a fault is irregular and not smooth. This is because the surface of the fault plane is irregular, similar to sandpaper.
3. Introduce the topic of friction. Ask students simple questions, such as what makes a car stop moving or what makes an ice skater slow down or stop. Tell students that such examples involve forces that may slow down, stop, or make it hard for an object to move. These forces are called frictional forces. Ask your students to think of other examples or ideas that involve friction (e.g., rubbing their hands together on a cold winter morning, lighting a match, wearing hiking boots when climbing or hiking down steep mountain slopes).
4. Explain to students that the amount of friction depends on two things: the type of surfaces that are touching (smooth kitchen floor versus a dirt road) and the forces pressing the surfaces together (pulling an empty cart versus one filled with groceries).
5. Tell students that faults lock because of their irregular surfaces. It is the force of friction that keeps these surfaces locked.
6. Explain to students that they are going to build a simple model that allows them to visualize what happens along a fault system.
Caution: Remind your students that models are simplifications of complex systems. In Lesson 1, students used an egg as a model of the Earth's interior. Ask students to briefly state a few of the limitations of the egg model. Explain to students that every model has its own limitations. Encourage them to think about some of the limitations of the model they are about to build throughout this lesson.
Procedures
1. Divide students into groups of five. Provide each group with two 4" x 4" wooden blocks (with screw eye already screwed in), a fabric measuring tape, a rubber band, one 4" x 36" sanding belt (50 Grit), one 1/3 sheet of sandpaper (60 Grit), duct tape, glue, and a pair of scissors.
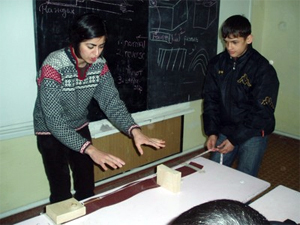
3. Ask one student from each group to stand at the right end of their sanding belt and hold on to the free end of the measuring tape. Ask the student to pull the measuring tape through the eyelet using a slow, steady pulling motion (figure 3). Invite other students in each group to observe the model carefully as one student pulls the tape. Ask them to list their observations. What happens to the rubber band as the measuring tape is gently pulled? What happens to the block? The rubber band is stretched before the block starts to move. When the block starts to move, the rubber band is no longer stretched.
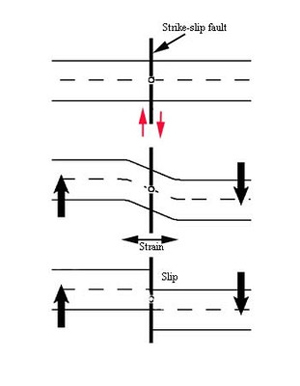
8. Explain to the students that their models demonstrate a process known as elastic rebound theory. Elastic rebound theory states that as tectonic plates move relative to each other, elastic energy (or strain) builds up in the rocks along fault planes. Since fault planes are irregular and not very smooth, they lock and energy starts to accumulate. When the elastic energy overcomes the friction forces that keep the fault planes together, rupture occurs. See figure 4 for a demonstration of this theory.
2. Give students the following directions:
- Cut the sanding belt so that it is no longer a connected loop.
- Secure both ends of the sanding belt to a classroom table. Make sure there are no waves in the sanding belt.
- Trace one of the blocks on the back of the sandpaper and use the scissors to cut out a square. Then glue the sandpaper square to the bottom of the block.
- Place the block on the sanding belt. The block should be on the left end of the sanding belt with the sandpaper-glued side touching the sanding belt. The screw eye must be positioned in the center of the sanding belt. Hook the rubber band into the screw eye.
- Attach the end of the measuring tape to the rubber band.
- Place the other block on its edge on the right end of the sanding belt. The screw eye should be positioned at the center of the sanding belt.
- The free end of the measuring tape should go through the screw eye of the block in the previous step.
Note: Figure 2 shows a complete model. It might be helpful to draw a picture of the model on the board as you give the above directions.
Figure 3: A student operating the model
4. Tell students that they have built a simple model allowing them to visualize what happens at a fault system. Ask them to compare their model with a fault system. What does the wooden block represent? What does the rubber band represent? What about the student who is pulling on the measuring tape? What about the pieces of sandpaper? The model's wooden block and sandpaper base represent an active fault section. Fault planes have irregular surfaces which are represented in this model by the sandpaper. The student who pulls on the measuring tape represents plate motions. The rubber band represents the elastic properties of the surrounding crustal material, which is capable of storing elastic energy.
5. Ask one student from each group to demonstrate what happens at a fault system again. As the student is demonstrating this, ask the rest of the students in each group to imagine looking at a fault system and describe what happens in the system. Then explain to them that because of plate motions at a distance (the student pulling on the tape), elastic energy starts to accumulate in the rocks around the fault (the rubber band is stretched). The fault begins to slip (the blocks begin to move) when the stress across it builds up to a sufficient level. Ask students what the movement of the model's wooden block represents in a fault system. The answer is: an earthquake.
6. Ask them where in their model they can observe friction. Ask a student to recall what friction is. Friction is the force resisting the relative motion of two surfaces in contact. By now, students should be able to point out that friction occurs at the contact surface between the sanding belt and the side of the block covered with sandpaper. Ask students if they are able to pull on the measuring tape without moving the block. Encourage them to try this if they haven't already. Then ask them why they are able to do it. The answer is that the sandpaper pieces are locked together, and this prevents the block from moving. In other words, it is the friction between the two uneven surfaces that prevents the block from moving forward. Explain to the students that in an active fault system, faults also lock. This allows the stress to build up in the surrounding rocks. Once the stress overcomes the forces of friction, the fault slips and an earthquake occurs. When an earthquake occurs, the stored energy is released by frictional heating on the fault, the crushing of rocks, and the propagation of earthquake waves.
7. Ask students to look at the rubber band more carefully after the block moves. Does the rubber band go totally slack after each movement? Allow them to try this a few times.
The answer is no. Ask them what this tells them about the release of stored energy on a fault when an earthquake occurs. Explain that some stored energy remains in the surrounding rocks after an earthquake, resulting in aftershocks. Aftershocks are earthquakes that follow the largest shock of an earthquake sequence. They are usually smaller than the main shock.
Figure 4: Illustration of elastic rebound theory (from top to bottom): original position of the road, strain builds up while the fault is locked, and then releases during an earthquake
9. Now is a good time to discuss some of the limitations of the model. Encourage students to share their thoughts. Ask them how their models might be unlike an actual fault and earthquake. For instance, the fault plane of their model is horizontal relative to the direction of gravity because of the way the model is arranged. In nature, such faults do not exist.
10. Ask students if by using their models they could predict the amount of displacement after each block motion and the amount of waiting time in between each block motion. Allow students to use their models to answer this question. Have one student in each group operate the model. Make sure to ask the student to use the same steady motion when pulling the tape. Ask students if they are able to get regular periodic behavior out of their models when they keep all variables the same. The answer is no. This demonstrates that predicting earthquakes is not going to be an easy task. If we cannot get regular behavior out of our simple models, it is very difficult to see it in the complex behavior of Earth systems.
11. Explain to students that quantitative measurement provides information in terms of numbers, proportions, or other measurable quantities. Ask them to name some other kinds of quantitative measures (minutes, hours, and centimeters). Now ask students what aspects of their model can be measured quantitatively. Students can measure the displacement after each block motion using a ruler and the timing in between each motion using a watch. Ask students if the steady pulling motion applied on the measuring tape by a student can be measured. What about the energy (or strain) in the rubber band?
12. Explain to students that scientists use a variety of methods to measure displacement along faults, timing between earthquake events, the motions of tectonic plates, and the stored elastic energy. These measurements help scientists to better understand earthquakes and make predictions about them.
13. Finish the discussion by asking one student to give a definition of an earthquake using the information they learned from operating their models.
Useful Resources
Further Exploration
Key Questions
No Question Links Are Available
Key Concepts
No Concept Links Are Available


