Geography and migration routes of the simulated model.
- Author: Douglas L. T. Rohde
Keywords
Flag Inappropriate
Delete Content
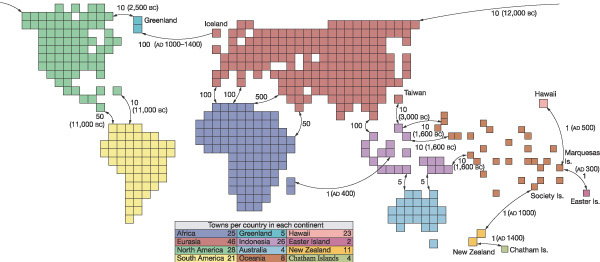
Geography and migration routes of the simulated model.
Arrows denote ports and the adjacent numbers are their steady migration rates, in individuals per generation. If given, the date in parentheses indicates when the port opens. Upon opening, there is usually a first-wave migration burst at a higher rate, lasting one generation.


Comments
CloseComments
Please Post Your Comment