This page has been archived and is no longer updated
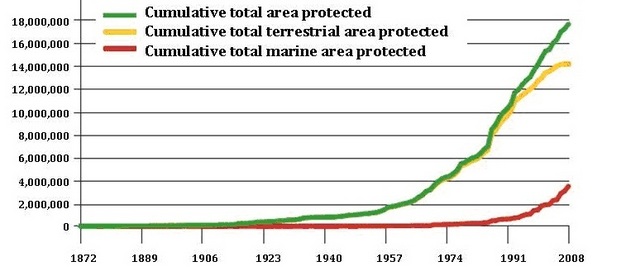
Figure 1. Growth in nationally designated protected areas from 1872 to 2008. Figure excludes protected areas with unknown year of establishment (UNEP-WCMC 2009).
Figure 1. Growth in nationally designated protected areas from 1872 to 2008. Figure excludes protected areas with unknown year of establishment (UNEP-WCMC 2009).


Comments
CloseComments
Please Post Your Comment