This page has been archived and is no longer updated
Figure 1.
Keywords
Keywords for this Article
Add keywords to your Content
Save
|
Cancel
Share
|
Cancel
Revoke
|
Cancel
Rate & Certify
Rate Me...
Rate Me
!
Comment
Save
|
Cancel
Flag Inappropriate
The Content is
Objectionable
Explicit
Offensive
Inaccurate
Comment
Flag Content
|
Cancel
Delete Content
Reason
Delete
|
Cancel
Close
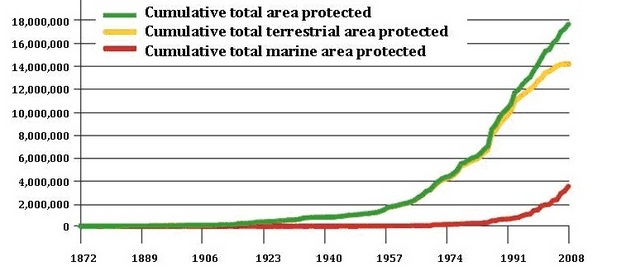
Figure 1.
Growth in nationally designated protected areas from 1872 to 2008. Figure excludes protected areas with unknown year of establishment (UNEP-WCMC 2009).
Add Content to Group
|
Bookmark
|
Keywords
|
Flag Inappropriate
share
Close
Digg
Facebook
MySpace
Google+
Comments
Close
Please Post Your Comment
*
The Comment you have entered exceeds the maximum length.
Submit
|
Cancel
*
Required
Comments
Please Post Your Comment
No comments yet.
Save Note
Note
View
Public
Private
Friends & Groups
Friends
Groups
Save
|
Cancel
|
Delete
Please provide your notes.
Next
|
Prev
|
Close
|
Edit
|
Delete
Genetics
Gene Inheritance and Transmission
Gene Expression and Regulation
Nucleic Acid Structure and Function
Chromosomes and Cytogenetics
Evolutionary Genetics
Population and Quantitative Genetics
Genomics
Genes and Disease
Genetics and Society
Cell Biology
Cell Origins and Metabolism
Proteins and Gene Expression
Subcellular Compartments
Cell Communication
Cell Cycle and Cell Division
Scientific Communication
Career Planning
Loading ...
Scitable Chat
Register
|
Sign In
Visual Browse
Close


Comments
CloseComments
Please Post Your Comment