A harvesting graph.
Keywords
Flag Inappropriate
Delete Content
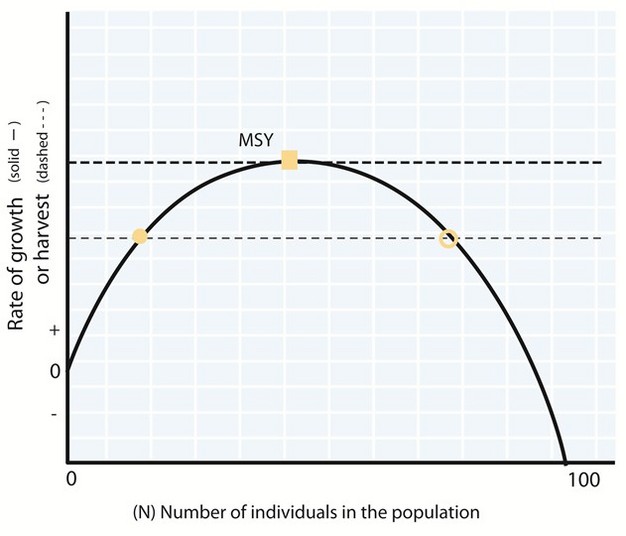
A harvesting graph.
The curve represents recruitment at a given N. The dashed lines are the number of animals to be harvested. If harvest is at the theoretical MSY, and recruitment drops due to environmental variation, the population may be harmed. The open circle represents a stable equilibrium, a level of harvesting which will not damage the population irrecoverably given normal variation in recruitment. The other point of intersect of the harvesting line is an unstable equilibrium. Even though recruitment is at the same rate as at the stable equilibrium, there are so few animals in the population that a drop in recruitment at this harvesting rate could easily destabilize the population.
This image is linked to the following Scitable pages:

Game managers apply ecological models to regulate harvest of economically important species.


Comments
CloseComments
Please Post Your Comment