


-
March 11, 2016
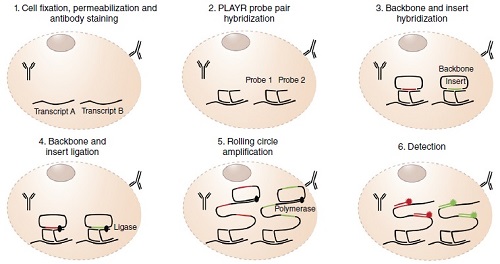
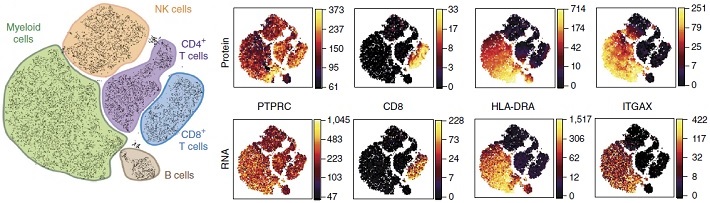
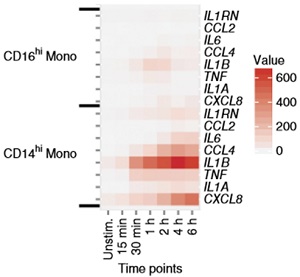
Rapid RNA analysis at a single cell level: a PL... -
February 11, 2016
Free to roam: implantable optogenetic devices -
January 23, 2016
The recipe for human serotonin neurons -
January 08, 2016
Designing logical cells to be disease sensors -
December 25, 2015
The synthesis of a bacterial clock -
November 30, 2015
Folding DNA origami for chemotherapy treatments -
November 07, 2015
Gene Editing in the Natural World: Part II -
October 08, 2015
Mining the depths for new anti-biotics -
September 16, 2015
The TRAP technique gets back to basics -
August 28, 2015
A history lesson: induced pluripotent stem cells -
August 07, 2015
Let there be light: Photoactivatable CRISPR-Cas9 -
July 16, 2015
Transparent brains: mining the depths -
June 24, 2015
Restoring sight with the help of optogenetics -
June 02, 2015
Discovering new cell types one at a time -
May 12, 2015
Treating spinal cord injuries with a dual actio... -
April 20, 2015
Reducing carbon: a bacterial approach -
April 06, 2015
Propagating mutations throughout an entire popu... -
March 23, 2015
This is your brain on integrated technology -
February 28, 2015
Gene Editing in the Natural World -
February 08, 2015
Editing the Genome Quickly and Efficiently: Rou... -
January 27, 2015
Editing the Genome Quickly and Efficiently: Rou... -
January 06, 2015
Enhancing our Gut Flora for disease and allergy... -
December 19, 2014
Controlling Neurons Using Light -
June 21, 2014
Where Conscious and Subconscious Meet -
June 07, 2014
Battle of the Genetic Codes -
May 28, 2014
Blog Update -
April 08, 2014
I Attend the 55th Annual Fly Meeting! -
January 06, 2014
Going Viral for the New Year -
October 13, 2013
How to Clone Yourself, Part 2: Stem Cell Reprog... -
September 24, 2013
How to Clone Yourself, Part 1: Start Small -
September 07, 2013
What I’ve Been Doing Lately -
August 06, 2013
Is in vitro meat all it’s cracked up to be? -
July 09, 2013
Engineering in the Wild: Driving Genes into Pop... -
June 17, 2013
Bee vs. Mite! – Puerto Rico’s Honey... -
June 04, 2013
It's in the Honey! - Bee Diet and Defense Again... -
May 21, 2013
Genetic Logic Gates and Flipping DNA -
April 07, 2013
#DROS2013 Day 4 -
April 06, 2013
#DROS2013 Day 3 -
April 05, 2013
#DROS2013 Day 2 -
April 03, 2013
#DROS2013 Day 1 -
March 27, 2013
Watch for it: Tweeting and Blogging from #DROS2013 -
March 13, 2013
Undergrads Launch Genetics Education Website -
March 05, 2013
Viruses swipe bacterial immune system, turn it ... -
February 26, 2013
An Update on Artemisinin -
February 09, 2013
Editing Genomes with the Bacterial Immune System -
January 11, 2013
The One and Only Popular Synthetic Biology Book -
December 30, 2012
Beyond Genetics: DNA in Nanotechnology -
December 25, 2012
Merry Yeast Christmas! -
November 29, 2012
Engineering Viruses is Hard. Let’s Make i... -
November 02, 2012
The Oddness of California Proposition 37 -
October 26, 2012
Bird of the Week: Yellow-Bellied Sapsucker -
October 23, 2012
Sending DNA Messages Inside Viruses -
October 18, 2012
Bird of the Week: Bullfinch -
October 13, 2012
Bird of the Week: Downy Woodpecker -
October 04, 2012
My First Paper: tRNAs as Genetic Switches -
September 29, 2012
Bird of the Week: Chimney Swift -
September 26, 2012
Cheaper Genomes Should Enhance Undergraduate Ed... -
September 20, 2012
Bird of the Week: White-Breasted Nuthatch -
September 14, 2012
Science Literacy for Everyone -
September 14, 2012
Bird of the Week: Indigo Bunting -
September 11, 2012
Molecular Zoo: E. coli RNA Polymerase -
September 08, 2012
Bird of the Week: Canada Goose -
August 31, 2012
Digital Data Storage in DNA -
August 29, 2012
Bird of the Week: Double Crested Cormorant -
August 24, 2012
Modular Transcription Factors for Eukaryotic Sy... -
August 19, 2012
Bird of the Week: Barn Swallow -
August 09, 2012
Bird of the Week: Common Raven -
August 07, 2012
Molecular Zoo: The TALE’s Tale -
July 30, 2012
Artificial Beginnings: Understanding the Origin... -
July 24, 2012
What the Simulated Cell Actually Means -
July 01, 2012
Zinc Fingers: An Emerging Tool for Gene Therapy -
June 18, 2012
Your Friend the Sequence Logo -
June 07, 2012
In Living Memory: the First Steps toward Geneti... -
May 28, 2012
High-Level Control of Synthetic Systems: The Ge... -
May 07, 2012
Final Exams Beckon... -
May 02, 2012
Artemisia annua: A Vital Partner in the Global ... -
April 22, 2012
Synthetic Nucleic Acids: Beyond DNA and RNA -
April 08, 2012
Horizontal Gene Transfer: A Force for Bacterial... -
March 12, 2012
Chemicals Responsible for Bee Scouting Behavior... -
February 18, 2012
DNA Nanorobot Targets Cells for Molecular Delivery -
January 22, 2012
Seaweed Biofuel, #ArsenicLife, and Synthetic Bi... -
January 14, 2012
Soldier Bees -
January 06, 2012
Synthetic Biology is on its Way to Treating Hum... -
December 25, 2011
Computer Controlled Yeast and an E. coli LCD Sc... -
November 24, 2011
Genomes at the Thanksgiving Table -
November 06, 2011
What can Synthetic Biology Teach us About Basic... -
October 29, 2011
What can Synthetic Biology Teach us About Basic... -
October 16, 2011
What can Synthetic Biology Teach us About Basic... -
October 11, 2011
When Will a Synthetic Biologist be called to St... -
September 24, 2011
Engineering Genetic Codes -
September 10, 2011
It's Raining Caterpillars! -
September 01, 2011
Remodeling Cells with RNA -
August 18, 2011
The Promises, Demands, and Risks of Garage Biology -
August 10, 2011
DIY Hardware for the Home Biology Lab -
August 03, 2011
Synthetic Biology at Home -
July 27, 2011
The Most Interesting Paper I've Ever Read -
July 20, 2011
DNA Synthesis -
July 13, 2011
High Throughput Sequencing and Cost Trends -
July 06, 2011
Sanger Sequencing -
June 29, 2011
Thinking Like Engineers -
June 23, 2011
Artemisinin: A Synthetic Biology Success Story -
June 14, 2011
Synthetic Biology in the Spotlight -
June 06, 2011
PCR: A Revolutionary Invention -
May 31, 2011
E. coli and Chassis -
May 23, 2011
Molecular Modeling -
May 16, 2011
Student Research -
May 09, 2011
Modeling and E. coli that Count -
May 02, 2011
DNA Origami -
April 25, 2011
The Repressilator -
April 18, 2011
Abstraction -
April 11, 2011
More on Operons -
April 03, 2011
Promoters
« Prev « Prev Next » Next »


