
Abstract
Here, we describe a robust protocol for the reverse transfection of cells on small interfering (siRNA) arrays, which, in combination with multi-channel immunofluorescence or time-lapse microscopy, is suitable for genome-wide RNA interference (RNAi) screens in intact human cells. The automatic production of 48 'transfection ready' siRNA arrays, each containing 384 samples, takes in total 7 h. Pre-fabricated siRNA arrays can be used without loss of transfection efficiency at least up to 15 months after printing. Different human cell lines that have been successfully transfected using the protocol are presented here. The present protocol has been applied to two genome-wide siRNA screens addressing mitosis and constitutive protein secretion.
Introduction
High-throughput parallel transfection techniques are a prerequisite to perform large-scale experiments, such as genome-wide RNAi screens, in mammalian tissue culture cells1,2,3,4. In such studies, transfections are typically performed in 96- or 384-well plates using liquid-handling robotics. Reverse transfection of cells on plasmid or siRNA arrays5,6,7,8,9,10 is a powerful alternative method to perform high-throughput transfections for phenotypic data acquisition by light microscopy.
Reverse transfection has several advantages compared with liquid phase transfections in 96- or 384-well plates. First, the high density of samples on the arrays allows increased data acquisition speed by microscopy. Second, the cost of each experiment is reduced owing to the small amount of siRNA needed per spot. Third, parallel cell seeding in a single chamber for 384 knock-down experiments with no physical separation between experiments/spots increases the screening data quality. These well-to-well variations occur in experiments in multiwell dishes. Furthermore, sample preparation steps, such as immunostaining, do not require further automation. Another major advantage of the reverse transfection protocol described here compared with liquid-phase transfections in multiwell formats is the possibility to produce exact replicate arrays, derived from the same sample source plate, and once dried the printed microarrays can be stored, as it is shown here, for at least 15 months without apparent loss of transfection efficiency. Such replicas can be the basis for several genome-wide screens, either for multiplexing of different biological assays or different cell lines, yielding directly comparable results because the microarrays are produced from the same source.
One of the limitations of reverse transfection is that applications with different cell lines have so far required variations in the protocols to manufacture siRNA or plasmid arrays, which involves a considerable amount of development and testing. A further crucial aspect of the technology is the possibility of cross-contamination of the array spots when spot densities increase; therefore, optimization of the array layout is important. Also, only small-scale projects have been described with the technology and it remains to be shown that it is also applicable to large scale, genome-wide siRNA screens.
Here, we describe a protocol (see Fig. 1 and Fig. 2 for an overview) that has been used for siRNA array production and application to two genome-wide siRNA screens in HeLa cells (cervix carcinoma cell line), and that works with similar efficiencies in several other cell types, including human primary fibroblasts

The workflow of the protocol described here is segmented in its main factors and starts from an siRNA library. The samples are automatically or manually prepared for the spotting process in 96- or 384-well formats (automatic preparation lasts 1 h) and are then spotted in LabTeks (lasts 6 h for 384 samples and printing of 48 LabTeks). After drying (minimum of 12 h) and storage (up to 15 months tested) of the LabTeks, mammalian cells are seeded on the LabTeks. Then, typically after 20 h, live cell imaging of the samples is started. For assays involving fixed and immunostained cells, incubation periods after cell seeding are typically between 48 and 60 h before fixation and immunostaining.

The DNA contact printer prints from the 384-well low volume plate (*) with eight solid pins (arrow) in LabTeks as shown in (a). A printed LabTek chamber with 384 spots is shown in (b) and a magnification of 84 dried spots (spot diameter: 400 μm and spot-to-spot distance: 1,125 μm) is shown in (c).
The preparation of the samples for spotting, including the mixing of transfection cocktails and siRNAs, has been automated in a 384-well plate format using an automated liquid handler. This process requires less than 1 h for the preparation of one 384-well plate. The printing of these 384 samples onto 48 replicates of chambered coverglass tissue culture dishes (LabTeks) is performed with a contact printer (automated microarrayer) and requires 6 h. After the spots, containing siRNAs and transfection solution, are dried on the coverglass for at least 12 h, mammalian cells are seeded onto the LabTek dishes for transfection. Typically, cells can be processed and analyzed by high-content-screening microscopy 20 h after cell seeding.
Materials
Reagents
-
siRNA oligonucleotides (Ambion), for sequences see ref. 6
-
Lipofectamine 2000 (Invitrogen, cat. no. 11668-019)
-
Sucrose (USB, cat. no. 21938)
-
Gelatin (Sigma-Aldrich, cat. no. G-9391)
-
Fibronectin, human (Sigma-Aldrich, cat. no. F0895)
-
OptiMEM I + GlutaMAX I (GIBCO, cat. no. 51985-026)
-
Drying pearls, orange – heavy metal free (Fluka, cat. no. 94098)
-
Hoechst dye solution 33342 (Sigma, cat. no. B2261)
-
Silicon grease (NEOLAB, cat. no. 1-2072)
-
CO2-independent media (Gibco, cat. no. 18045-054)
-
Mowiol 4-88 (Sigma-Aldrich, cat. no. 81381)
-
Sodium azide (Appli Chem, cat. no. A1430)
-
Paraformaldehyde (PFA) (Electron Microscopy Sciences, cat. no. 15710)
-
BSA (Sigma-Aldrich, cat. no. A9056)
-
Triton solution (Sigma-Aldrich, cat. no. 234729)
-
Cell lines:
-
Osteosarcoma, U2OS (ATCC, cat. no. HTB-96)
-
Retinal pigment epithelial cells, hTERT-RPE1 (ATCC, cat. no. CRL-4000)
-
Lung carcinoma cell line, A549 (ATCC, cat. no. CCL-185)
-
Human umbilical vein endothelial cells, HUVEC (PromoCell, cat. no. C-12200)
-
Cervix carcinoma cells, HeLa 'Kyoto' (Prof. Shuh Narumiya, Kyoto University and Toru Hirota, IMP, Vienna)
-
Primary human skin fibroblasts (Dr. Heiko Runz, University of Heidelberg)
Equipment
-
384-well low volume plates (Nalge Nunc International, cat. no. 264360)
-
96-well standard plates (Kisker, cat. no. G060)
-
Sterile filter (0.45 μm) (MILLIPORE, cat. no. SCHVU01RE)
-
Reservoir (Nalge Nunc International, cat. no. 370905)
-
Automated liquid handling robot, 'MICROLAB STAR' (Hamilton); equipped with:96-channel head and coolable carrier blocks for multiwell plates
-
Standard volume tips without filter − 300 μl (Hamilton, cat. no. 235900)
-
Low volume tips without filter − 10 μl (Hamilton, cat. no. 235902)
-
Heraeus multifuge 3S (Kendro, cat. no. 75004361)
-
Contact printers, ChipWriter 'Compact' and 'Pro' (Bio-Rad Laboratories)
-
Temperature controlled plate, order no. 26-1-0 (EMBL)
-
Solid pins (Point Technologies, cat. no. PTS 600)
-
LabTek chambered coverglass (Nalge Nunc International, cat. no. 155361)
-
Gel drying box for storage of printed LabTeks (The Stewart Company)
-
Scanning microscope (scan^R, Olympus Biosystems)
-
10× objective (Olympus, cat. no. UPSLAPO 10×)
Reagent Setup
-
Growth medium DMEM supplemented with 10% (v/v) heat-inactivated fetal calf serum, 2 mM glutamine, 100 U ml−1 penicillin and 100 μg ml−1 streptomycin
-
96-well transfection stock solution for liquid handler 18 μl OptiMEM containing 0.4 M sucrose + 21 μl Lipofectamine 2000 per well
-
96-well gelatin/fibronectin stock solution for liquid handler 0.2 % (w/v) gelatin solution containing 1 × 10⁻² % (v/v) fibronectin
Procedure
Preparation of spotting solution
-
1
Prepare the spotting solution either manually (option A) or using a pipetting robot (option B).
-
A
Manual preparation of the spotting solution:
-
i
Prepare an siRNA stock solution by dissolving lyophilized siRNAs with milliQ water to a final concentration of 30 μM.
-
ii
Transfer 3 μl of OptiMEM, containing 0.4 M sucrose, to each well of a 384-well low volume plate.
Critical Step
Prepare the OptiMEM (containing 0.4 M sucrose) freshly.
-
iii
Add 3.5 μl Lipofectamine 2000 to each well of the 384-well low volume plate and mix thoroughly.
Critical Step
The same batch of the transfection reagent should be used for the whole experiment. We observed a high batch-to-batch variation in performance of the Lipofectamine 2000 transfection reagent. Therefore, we recommend testing different batch numbers of the transfection reagent and then using only one batch for a whole genome-wide project using reverse transfection of siRNAs.
-
iv
Add 5 μl of the respective siRNA stock solution to each well of the 384-well low volume plate and mix thoroughly.
-
v
Incubate for 20 min at room temperature (20–23 °C).
-
vi
Add 7.25 μl of a 0.2 % (w/v) gelatin solution containing 1 × 10⁻² % (v/v) fibronectin to each well of the 384-well low volume plate and mix thoroughly.
Critical Step
Prepare the gelatin solution freshly. Dissolve the gelatin powder at 56 °C for 20 min in milliQ water. Cool it down to room temperature and filter the solution with a sterile filter (0.45 μm).
-
i
-
B
Automatic preparation of the spotting solution for 384 samples on a Hamilton 'MICROLAB STAR' pipetting robot:
-
i
Prepare a 96-well transfection stock solution plate manually, and place it in the pipetting robot. Keep it at room temperature.
Critical Step
Prepare the OptiMEM (containing 0.4 M sucrose) freshly. The same batch number of the transfection reagent should be used for the whole project. We observed a high batch-to-batch variation in performance of the Lipofectamine 2000 transfection reagent. Therefore, we recommend testing different batch numbers of the transfection reagent and then use of only one batch for a whole genome-wide project using reverse transfection of siRNAs.
-
ii
Prepare a 96-well gelatin/fibronectin stock solution plate manually, with 48 μl gelatin/fibronectin stock solution and place it in the pipetting robot. Keep it at room temperature.
Critical Step
Prepare the gelatin solution freshly. Dissolve the gelatin powder at 56 °C for 20 min in milliQ water. Cool it down to room temperature and filter the solution with a sterile filter (0.45 μm).
-
iii
Prepare the siRNA stock solution by dissolving lyophilized siRNAs (4 nmols, delivered by manufacturer in 96-well plates) in four standard 96-well plates with 130 μl milliQ water taken from reservoir, filled with 400 ml of milliQ water (final concentration: 30 μM) per well on cooled carrier blocks (14 °C) using standard 300 μl volume tips without filters. The liquid handler is thereby adjusted to a mix volume of 100 μl and eight cycles of mixing using the 96-channel head.
-
iv
Transfer 6.5 μl of the transfection stock solution (from Step 1B(i)) into each well of a 384-well low volume plate using 10 μl low volume tips without filters (using the 96-channel head) at room temperature.
-
v
Transfer 5 μl of the siRNA stock solution (from Step 1B(iii)) into the 384-well low volume plate. The liquid handler is thereby adjusted to a mix volume of 7 μl and eight cycles of mixing (using 96-channel head) at room temperature.
Critical Step
This step is crucial because the number of cycles influences the transfection efficiency.
-
vi
Incubate for 20 min at room temperature.
-
vii
Add 7.25 μl of the gelatin/fibronectin stock solution into each well of the 384-well low volume plate. The liquid handler is thereby adjusted to a mix volume of 10 μl and eight cycles of mixing (using the 96-channel head).
-
i
-
A
-
2
Using the multifuge 3S, centrifuge the 384-well low volume plate for 15 s at 54g at room temperature to straighten the surface of the samples and place immediately in the contact printer.
Contact printing
-
3
Adjust the number of pins in the contact printer. We routinely use eight solid pins PTS 600. The spot diameter of the solid pins PTS 600 pins is about 400 μm. Smaller pin sizes create a smaller spot diameter (e.g., for PTS 400 pins the spot size is about 270 μm) resulting in less cells per spot.
-
4
Adjust the temperature of the 384-well plate on an in-house built temperature controlled plate to 12 °C to avoid evaporation of the sample.
-
5
Set the spot-to-spot distance in the contact printer menu with respect to the application in mind. We routinely use either 900 μm, 1,125 μm, 1,500 μm or 2,250 μm. This correlates to the following number of sample spots per LabTek: 900 μm distance = 600 samples per LabTek; 1,125 μm distance = 384 samples per LabTek; 1,500 μm distance = 216 samples per LabTek; and 2,250 μm distance = 96 samples per LabTek. For HeLa cells we routinely use 1,125 μm. Increase the spot-to-spot distance if cross-contamination is seen for different cell lines.
-
6
Set the dwell time of the pins in the 384-well low volume plate (time pins stay in the spotting solution) in the contact printer menu to 0.5 s.
-
7
Set the LabTek dwell time (time pins stay on LabTek chambered coverglass) in the contact printer menu to 0.3 s.
-
8
Carry out solid pin washing between individual samples. The procedure is setup in the following way: Pins remain in the washing container for 10 s at room temperature. The washing container is an inbuilt basin filled with milliQ water. The insertion depth of the pins in the basin is adjusted to ∼3 mm. Pins remain in the sonication container for 10 s at room temperature. The sonication container is an inbuilt sonication basin filled with milliQ water. The insertion depth of the pins in the basin is adjusted to ∼3 mm. Move the pins above the holes of the vacuum drying array of the contact printer and vacuum dry the pins for 10 s at room temperature.
Storage
-
9
After printing, immediately place the printed LabTeks in a gel drying box, add 50 g of drying pearls and securely and carefully close the box. LabTek chambers need to be dried for at least 12 h in this way before they can be used for transfection experiments.
Pause point
Printed LabTeks can be stored for more than 15 months without any apparent loss of transfection efficiencies.
(see Fig. 3)
Figure 3: The penetrance for the three positive controls is plotted against the number of days between spotting and cell seeding. 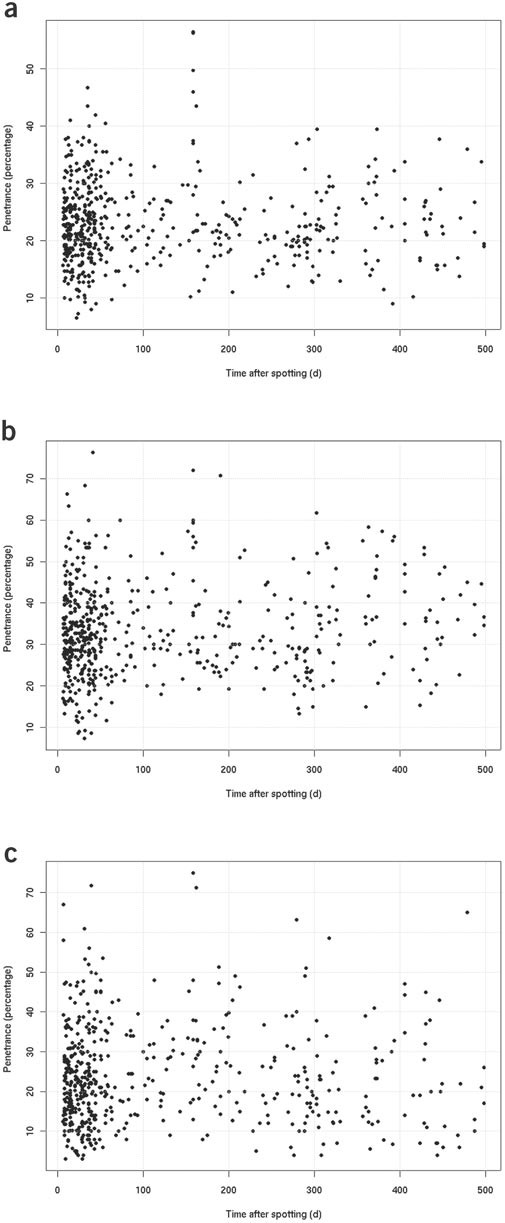
For each control, the penetrance value shown in the diagram was calculated as the average of the penetrance values obtained for the single control experiments on each LabTek dish. For each control experiment and time-point, the percentage of cell nuclei showing the control-specific phenotype (see examples in Fig. 5) in the spot of interest was determined. The penetrance value of the single control experiment was then defined as the maximal percentage obtained. The typical phenotypes obtained by the control siRNAs are shown in Fig. 5c–e. Results obtained with the siRNA targeting KIF11 (kinesin family member 11) (a); results obtained with the siRNA targeting INCENP (inner centromere protein) (b); results obtained with the siRNA targeting COPB (coat protein, subunit beta 1) (c).

Cell seeding on siRNA spotted LabTeks
-
10
To aid identification of the siRNA spot-matrix on the microscope, the first siRNA spot of the array is marked with a permanent marker pen on the opposite side of the cell growth area prior to cell plating.
Critical Step
The microscope acquires images in defined distances related to the first spot (see Steps 5, 25 and 26).
-
11
Split confluent stock cell cultures of HeLa cells (1:3) 24 h prior to their seeding on the dried siRNA LabTek arrays. The split ratio might vary from cell type to cell type and needs to be determined individually for alternative cell types.
Critical Step
This step helps to avoid cell clumping on the LabTeks and further ascertains that an actively growing cell population is plated.
-
12
Following trypsinization and cell counting, plate 1.5 ml of 7.5 × 10⁴ cells ml−1 actively growing HeLa cells in a suspension of growth medium upon each LabTek by carefully dispensing the cell suspension to the centre of the LabTek using a 5 ml pipette. While dispensing, contact should be maintained between the pipette tip and the dispensed cell suspension to ensure spread of the cell suspension upon the LabTek. Bubbles and any contact between the pipette tip and the glass of the LabTek itself should be avoided as this could disrupt the array. For other cell lines we also plate 1.5 ml of cell suspension with the following number of actively growing cells per ml: A549, 8 × 10⁴; U2OS, 10 × 104; hTERT–RPE1, 10 × 104; primary human skin fibroblasts, 5 × 10⁴; HUVEC, 8 × 10⁴.
-
13
Once the cell suspension has been dispensed, gently tilt the LabTek to each of the four corners to ensure thorough coverage of cells across the chamber surface.
-
14
Incubate cells plated on LabTeks in 1.5 ml growth medium at 37 °C with 5% CO2.For time-lapse microscopy we typically incubate them for 20 h. For time-lapse microscopy replace the medium 20 h after cell seeding with 5 ml CO2-independent growth medium just prior to imaging and seal the LabTeks at the lid with silicon grease to avoid drying.
Immunostaining of cell arrays
-
15
Depending on the primary antibody used for immunostaining, and the cellular structures to be labeled, fix cells with 4% (w/v) PFA in PBS11 for 10 min at room temperature or in 100% methanol for 2 min at −20 °C. When fixation with methanol is used, cells already become permeabilized such that antibodies can cross the plasma membrane and gain access to intracellular antigen. In this case Step 16 can be omitted. This kind of fixation is very good for staining the cytoskleleton, the Golgi complex and the endoplasmic reticulum. In the case of PFA fixation, the plasma membrane stays intact and only antigene domains accessible from the outer side of the plasma membrane can be stained. To stain intracellular structures in PFA fixed cells, they need to be permeabilized as described in Step 16. Which antibodies give better results by which fixation method needs to be tested using separate experiments before applying it to the staining of cell arrays.
-
16
Wash twice for 2 min at room temperature with 1 ml of 1 × PBS/0.1% (v/v) Triton solution.
-
17
Incubate for 30 min at room temperature with a 3% BSA/1 × PBS (w/v) solution.
-
18
Apply 250−800 μl of the first antibody solution by carefully and gently distributing it over the spotted area. Incubate for 10 min (time may vary depending on the primary antibody used) at room temperature.
-
19
Wash twice for 5 min at room temperature with 1 ml PBS.
-
20
Incubate with secondary antibody as recommended by the supplier.
Pause point
Store stained dishes either by embedding in Mowiol (ref. 11) or by adding 1 ml PBS containing 0.01% (w/v) azide. In the latter case, cell stainings are preserved for long-term storage by a further incubation of stained cells for 2 min at room temperature with 4% (w/v) PFA in PBS (post-staining fixation) followed by two washes with PBS.
-
21
Stain cell nuclei with 1.5 ml Hoechst dye solution (1 μg ml−1 final concentration, in PBS) for 10 min at room temperature, followed by an additional washing step with PBS for 5 min. Because Hoechst staining is a strong and robust way to highlight cell nuclei, we routinely use this staining during image acquisition for automated identification of the focal plane12. It also serves for the identification of all cell nuclei during automated image analysis (see for example refs 12,13).
Scanning microscopy
-
22
In our laboratory we image cell arrays using a scan^R fluorescence microscope (Fig. 4) equipped as described in ref. 6. Place four LabTeks in an in-house built holder (see Fig. 4) and secure them tightly with springs.
Figure 4: The automatic microscope and substrate (LabTek) holder. 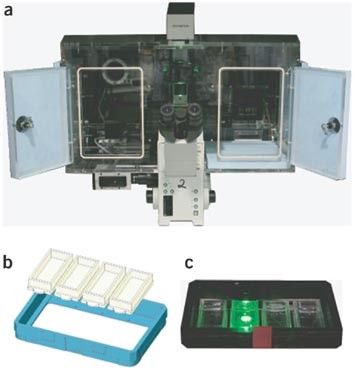
The automatic scan^R microscope with incubation chamber is shown in (a). A drawing of the holder for four LabTek chambers is shown in (b). An image of the holder with four LabTeks in position is shown in (c).
-
23
Choose objective (e.g., a 10×/0.4 air objective).
-
24
Choose exposure time and filter set according to dye.
-
25
Assign the first spot on each of the four LabTeks. For this, observe LabTeks in bright-field illumination, which allows clear identification of each first spot owing to its labeling with indelible ink (see Step 10). Store each of the four positions in the computer using the scan^R software.
Critical Step
The microscope acquires images in defined distances related to the first spot (see Step 5).
-
26
Assign the spot-to-spot distance with respect to the values used for array production (see section on 'Contact printing').
-
27
Start automated data acquisition.

Image processing and data analysis
-
28
Analysis of images acquired automatically depends strongly on the assay applied and therefore requires custom developments or adaptation of commercial software. Perform analysis either using the analysis package provided by the scan^R microscope system (when fluorescence intensities are to be measured, see also efs 12,13) or using software that has been developed for assay-specific phenotyping of cells6,14. As a general point, we use our scrambled controls – siRNA not targeting any gene – (Fig. 5) to normalize our assay results.
Figure 5: Cell proliferation and phenotypes of control genes on a cell array. 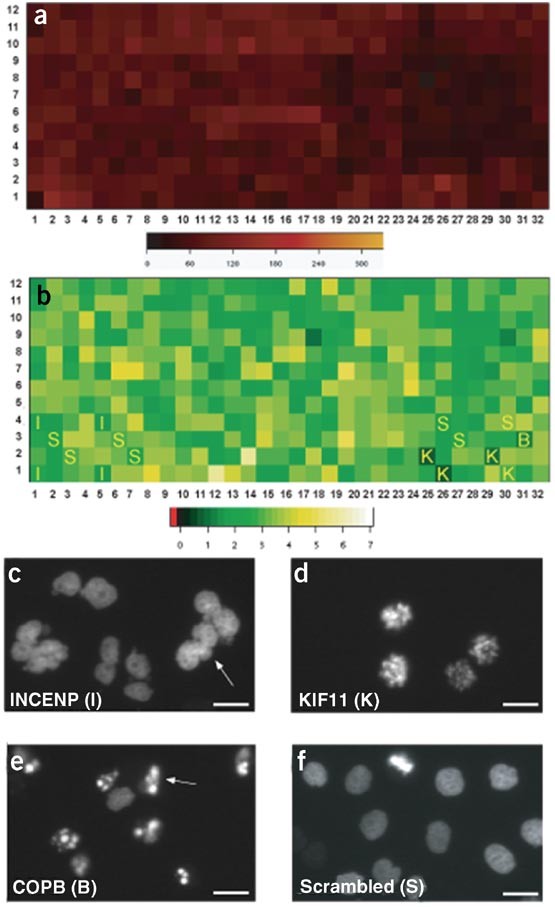
Typical results obtained for the cell density and cell proliferation from one LabTek in a time-lapse experiment studying cell cycle progression and mitosis (see ref. 6) are shown. The color-coded cell numbers are shown in a heat map 20 h after cell seeding, where each square represents one spot (a). The color-coded proliferation rate, which was calculated by dividing the cell number at the end of the time-lapse experiment by the number at the beginning, is shown in (b). The axes indicate the columns and rows of the siRNA cell array and the letters the control genes (c–f). Typical images of cell nuclei obtained in spots containing the positive control siRNAs are shown in (c)–(f). (c) I = INCENP (inner centromere protein); (d) K = KIF11 (kinesin family member 11); (e) B = COPB (coat protein, subunit beta 1); (f) S = cells on a scrambled control spot. Arrows point to typical phenotype specific cells. Scale bars = 20 μm

Quality control
-
29
In total, we distribute 16 control siRNAs on the LabTek (Fig. 5). These comprise negative controls (scrambled siRNA) that have been tested not to interfere with cell growth, mitosis and secretion. Ideally, distribute the negative controls throughout the entire LabTek. In addition, we have also spotted three different positive controls targeting different genes. These siRNAs cause clearly visible phenotypes as shown in Fig. 5. As some of these positive control siRNAs are spotted at the edges of the array (see Fig. 5b), identification of their phenotypes by automated image acquisition and analysis determines the correct positioning and alignment of the arrays in use. Only when these phenotypes can be clearly seen on the array, it can be assumed that the array is aligned and siRNA transfection has in principle been successful. Characterize the positive control siRNAs by the following phenotypes: (i) siRNA targeting INCENP (inner centromere protein): cells exhibit butterfly like nuclei (Fig. 5c). This shape phenotype is visible between 20 h and 64 h after cell seeding and then cells start to undergo cell death. This INCENP phenotype is long lasting and is therefore suitable for assays with different time windows. (ii) siRNA targeting KIF11 (kinesin family member 11): cells show a prometaphase arrest starting 17 h after cell seeding (Fig. 5d). Cells stay between 12 and 20 h in this prometaphase arrest and then undergo cell death. This control is more suitable for assays investigating early time points after cell seeding. (iii) siRNA targeting COPB (coat protein, subunit beta 1): protein secretion from cells is inhibited and cells start to undergo cell death 40 h after cell seeding (Fig. 5e). Maximum penetrance of this phenotype occurs between 60 and 70 h after cell seeding.
Troubleshooting
For troubleshooting advice, refer to Table 1
Timing
Steps 1–2: Preparation of the spotting solution: 1 h (automatically)
Steps 3–8: Contact printing: 6 h (48 LabTeks)
Step 9: Storage: 12 h – 15 months
Steps 10–14: Cell seeding: 1 h
Steps 15–21: Immunostaining of cell arrays: 2 h
Steps 22–27: Scanning microscopy: typically 4 h for fixed time point assays and 48 h for time-lapse experiments
Step 28: Image processing and data analysis: depending on assay and processing speed
Step 29: Quality control: typically 10 min automatically
Anticipated results
One of the main applications of the protocol described here is in genome-wide siRNA screens using high-content-screening microscopy. In our laboratory, arrays produced with the described protocol have been used for two genome-wide siRNA screens, one investigating mitosis and cell-cycle progression by time-lapse microscopy (data not shown; see also ref. 6 and Fig. 5) and the other one studying constitutive protein secretion using quantitative microscopy in fixed cells (data not shown), see also ref. 7). Evenness of cell seeding in LabTeks is demonstrated by Fig. 5a, showing cell numbers in the spots 20 h after seeding. In our experience, in these large-scale experiments the fraction of arrays that failed to reproduce the phenotypes of the positive control siRNAs is less than 10% (Fig. 5). Furthermore, the arrays produced can still be used even 15 months after printing without any apparent loss in efficiency (Fig. 3). An example testing the reproducibility of the method is shown in Fig. 6.

Results of positive (KIF11 and INCENP) and negative (scrambled) controls from three replicates of the same LabTek are shown. The maximum percentages of cell nuclei per spot area and per time-lapse movie, showing the specified phenotype, either 'shape' for INCENP showing butterfly like nuclei or 'prometaphase' for KIF11 showing condensed nuclei, (called penetrance) are shown.
Tests have also shown that the arrays produced with the protocol described here can be used for reverse transfecting A549, U2OS, hTERT–RPE1, primary human skin fibroblasts, HUVEC and HeLa cells.
References
Pelkmans, L. et al. Genome-wide analysis of human kinases in clathrin- and caveolae/raft-mediated endocytosis. Nature 436, 78–86 (2005).
Sonnichsen, B. et al. Full-genome RNAi profiling of early embryogenesis in Caenorhabditis elegans . Nature 434, 462–469 (2005).
Mukherji, M. et al. Genome-wide functional analysis of human cell-cycle regulators. PNAS 103, 14819–14824 (2006).
Bard, F. et al. Functional genomics reveals genes involved in protein secretion and Golgi organization Nature 439, 604–607 (2006).
Ziauddin, J. & Sabatini, D.M. Microarrays of cells expressing defined cDNAs. Nature 411, 107–110 (2001).
Neumann, B. et al. High-throughput RNAi screening by time-lapse imaging of live human cells. Nature Methods 3, 385–390 (2006).
Erfle, H. et al. siRNA cell arrays for high-content screening microscopy. Biotechniques. 37, 454–458, 460, 462 (2004).
Silva, J.M. et al. RNA interference microarrays: High-throughput loss-of-function genetics in mammalian cells. PNAS 101, 6548–6552 (2004).
Mousses, S. et al. RNAi microarray analysis in cultured mammalian cells. Genome Res. 13, 2341–2347 (2003).
Kumar, R. et al. High-throughput selection of effective RNAi probes for gene silencing. Genome Res. 13, 2333–2340 (2003).
Pepperkok, R. et al. Imunofluorescence Microscopy. Monoclonal Antibodies: A Practical Approach 355–370 (Oxford University Press, New York, 2000).
Liebel, U. et al. A microscope-based screening platform for large-scale functional protein analysis in intact cells. FEBS Lett. 554, 394–398 (2003).
Starkuviene, V. et al. High-content screening microscopy identifies novel proteins with a putative role in secretory membrane traffic. Genome Res. 14, 1948–1956 (2004).
Conrad, C. et al. Automatic identification of subcellular phenotypes on human cell arrays. Genome Res. 14, 1130–1136 (2004).
Acknowledgements
The authors would like to acknowledge funding within the MitoCheck consortium by the European Commission (FP6-503464 to J.E.), as well as by the Federal Ministry of Education and Research (BMBF) in the framework of the National Genome Research Network (NGFN) (NGFN-2 SMP-RNAi, FKZ01GR0403 to J.E. and NGFN-2 SMP-Cell FKZ01GR0423, NGFN-1 FKZ01GR0101, FKZ01KW0013 to R.P.). The J.E. and R.P. labs are supported by a grant of the Landesstiftung Baden Wuerttemberg in the framework of the research programme 'RNS/RNAi'.
Author information
Authors and Affiliations
Corresponding author
Ethics declarations
Competing interests
The authors declare no competing financial interests.
Rights and permissions
About this article
Cite this article
Erfle, H., Neumann, B., Liebel, U. et al. Reverse transfection on cell arrays for high content screening microscopy. Nat Protoc 2, 392–399 (2007). https://doi.org/10.1038/nprot.2006.483
Published:
Issue Date:
DOI: https://doi.org/10.1038/nprot.2006.483
This article is cited by
-
A low-cost self-dispersing method of droplet array generation enabled by a simple reusable mask for bioanalysis and bioassays
Analytical and Bioanalytical Chemistry (2022)
-
Pairwise effects between lipid GWAS genes modulate lipid plasma levels and cellular uptake
Nature Communications (2021)
-
Multiplexed Optical Sensors in Arrayed Islands of Cells for multimodal recordings of cellular physiology
Nature Communications (2020)
-
A protocol for the systematic and quantitative measurement of protein–lipid interactions using the liposome-microarray-based assay
Nature Protocols (2016)
-
Differential TGFβ pathway targeting by miR-122 in humans and mice affects liver cancer metastasis
Nature Communications (2016)
Comments
By submitting a comment you agree to abide by our Terms and Community Guidelines. If you find something abusive or that does not comply with our terms or guidelines please flag it as inappropriate.
