
Abstract
Spatio-temporal travelling waves are striking manifestations of predator–prey and host–parasite dynamics. However, few systems are well enough documented both to detect repeated waves and to explain their interaction with spatio-temporal variations in population structure and demography. Here, we demonstrate recurrent epidemic travelling waves in an exhaustive spatio-temporal data set for measles in England and Wales. We use wavelet phase analysis, which allows for dynamical non-stationarity—a complication in interpreting spatio-temporal patterns in these and many other ecological time series. In the pre-vaccination era, conspicuous hierarchical waves of infection moved regionally from large cities to small towns; the introduction of measles vaccination restricted but did not eliminate this hierarchical contagion. A mechanistic stochastic model suggests a dynamical explanation for the waves—spread via infective ‘sparks’ from large ‘core’ cities to smaller ‘satellite’ towns. Thus, the spatial hierarchy of host population structure is a prerequisite for these infection waves.
This is a preview of subscription content, access via your institution
Access options
Subscribe to this journal
Receive 51 print issues and online access
$199.00 per year
only $3.90 per issue
Buy this article
- Purchase on Springer Link
- Instant access to full article PDF
Prices may be subject to local taxes which are calculated during checkout


References
Murray, J. D. Mathematical Biology (Springer, London, 1989).
Neubert, M. G., Kot, M. & Lewis, M. A. Dispersal and pattern formation in a discrete-time predator–prey model. Theor. Pop. Biol. 48, 7–43 (1995).
Sherratt, J. A. Periodic travelling waves in cyclic predator–prey systems. Ecol. Lett. 4, 30–37 (2001).
Hassell, M. P., Comins, H. N. & May, R. M. Spatial structure and chaos in insect population dynamics. Nature 353, 255–258 (1991).
Sole, R. V., Valls, J. & Bascompte, J. Spiral waves, chaos and multiple attractors in lattice models of interacting populations. Phys. Lett. A 166, 123–128 (1992).
Jeltsch, F., Muller, M. S., Grimm, V., Wissel, C. & Brandl, R. Pattern formation triggered by rare events: Lessons from the spread of rabies. Proc. R. Soc. Lond. B 264, 495–503 (1997).
Bjørnstad, O. N., Ims, R. A. & Lambin, X. Spatial population dynamics: analysing patterns and processes of population synchrony. Trends Ecol. Evol. 14, 427–432 (1999).
Blasius, B., Huppert, A. & Stone, L. Complex dynamics and phase synchronization in spatially extended ecological systems. Nature 399, 354–359 (1999).
Mollison, D. Modeling biological invasions—chance, explanation, prediction. Phil. Trans. R. Soc. Lond. B 314, 675–693 (1986).
Bulmer, M. G. A statistical analysis of the 10-year cycle in Canada. J. Anim. Ecol. 43, 701–718 (1974).
Lambin, X., Elston, D. A., Petty, S. J. & MacKinnon, J. L. Spatial asynchrony and periodic travelling waves in cyclic populations of field voles. Proc. R. Soc. Lond. B 265, 1491–1496 (1998).
Ranta, E. & Kaitala, V. Travelling waves in vole population dynamics. Nature 390, 456–456 (1997).
Stenseth, N. C. et al. Common dynamic structure of Canada lynx populations within three climatic regions. Science 285, 1071–1073 (1999).
Cliff, A. D., Haggett, P. & Smallman-Raynor, M. Measles: An Historical Geography of a Major Human Viral Disease from Global Expansion to Local Retreat, 1840–1990 (Blackwell, Oxford, 1993).
Grenfell, B. T. & Bolker, B. M. Cities and villages: infection hierarchies in a measles metapopulation. Ecol. Lett. 1, 63–70 (1998).
Bartlett, M. S. in Proc. Third Berkeley Symp. on Mathematical Statistics and Probability Vol. 4, 81–109 (Univ. California Press, Berkeley, 1956).
Schenzle, D. An age-structured model of pre- and post-vaccination measles transmission. IMA J. Math. Appl. Med. Biol. 1, 169–191 (1984).
Anderson, R. M. & May, R. M. Infectious Diseases of Humans: Dynamics and Control (Oxford Univ. Press, Oxford, 1991).
Grenfell, B. T. & Harwood, J. (Meta)population dynamics of infectious diseases. Trends Ecol. Evol. 12, 395–399 (1997).
Earn, D. J. D., Rohani, P., Bolker, B. M. & Grenfell, B. T. A simple model for complex dynamical transitions in epidemics. Science 287, 667–670 (2000).
Finkenstädt, B. F. & Grenfell, B. T. Time series modelling of childhood diseases: a dynamical systems approach. J. R. Stat. Soc. C 49, 187–205 (2000).
Grenfell, B. T., Bjornstad, O. N. & Finkenstädt, B. F. Dynamics of measles epidemics. II. Scaling noise, determinism and predictability with the time series SIR model. Ecol. Monogr. (in the press).
Torrence, C. & Compo, G. P. A practical guide to wavelet analysis. Bull. Am. Meteorol. Soc. 79, 61–78 (1998).
Nason, G. P. & von Sachs, R. Wavelets in time series analysis. Phil. Trans. R. Soc. Lond. A 357, 2511–2526 (1999).
Daubechies, I. Ten Lectures on Wavelets (Society for Industrial and Applied Mathematics, Philadelphia, 1992).
Percival, D. B. & Walden, A. T. Wavelet Methods for Time Series Analysis (Cambridge Univ. Press, Cambridge, 2000).
Bartlett, M. S. Measles periodicity and community size. J. R. Stat. Soc. A 120, 48–70 (1957).
Anderson, R. M., Grenfell, B. T. & May, R. M. Oscillatory fluctuations in the incidence of infectious disease and the impact of vaccination: time series analysis. J. Hyg. 93, 587–608 (1984).
Chatfield, C. The Analysis of Time Series: An Introduction (Chapman and Hall, London, 1996).
Finkenstädt, B. F. & Grenfell, B. T. Empirical determinants of measles metapopulation dynamics in England and Wales. Proc. R. Soc. Lond. B 265, 211–220 (1998).
Lloyd, A. L. & May, R. M. Spatial heterogeneity in epidemic models. J. Theor. Biol. 179, 1–11 (1996).
Earn, D., Rohani, P. & Grenfell, B. T. Spatial dynamics and persistence in ecology and epidemiology. Proc. R. Soc. Lond. B 265, 7–10 (1998).
Bolker, B. M. & Grenfell, B. T. Impact of vaccination on the spatial correlation and dynamics of measles epidemics. Proc. Natl Acad. Sci. USA 93, 12648–12653 (1996).
Cliff, A. D., Haggett, P., Stroup, D. F. & Cheney, E. The changing geographical coherence of measles morbidity in the United States, 1962–88. Stat. Med. 11, 1409–1424 (1992).
Bartless, M. S. The critical community size for measles in the U.S. J. R. Stat. Soc. A 123, 37–44 (1960).
Grenfell, B. T., Bolker, B. M. & Kleczkowski, A. Seasonality and extinction in chaotic metapopulations. Proc. R. Soc. Lond. B 259, 97–103 (1995).
Kendall, B. E., Schaffer, W. M. & Tidd, C. W. Transient periodicity in chaos. Phys. Lett. A 177, 13–20 (1993).
Bradshaw, G. A. & Spies, T. A. Characterizing canopy gap structure in forests using wavelet analysis. J. Ecol. 80, 205–215 (1992).
Bjørnstad, O. N. & Bascompte, J. Synchrony and second order spatial correlation in host-parasitoid systems. J. Anim. Ecol. 70, 924–933 (2001).
Schaffer, W. M. & Kot, M. Nearly one dimensional dynamics in an epidemic. J. Theor. Biol. 112, 403–427 (1985).
Schwartz, I. B. in Biomedical Modelling and Simulation (eds Eisenfeld, J. & Levine, D. S.) 201–204 (Scientific, New York, 1989).
Bolker, B. M. & Grenfell, B. T. Space, persistence and the dynamics of measles epidemics. Phil. Trans. R. Soc. Lond. B 348, 309–320 (1995).
Hanski, I. & Gyllenberg, M. Two general metapopulation models and the core-satellite hypothesis. Am. Nat. 142, 17–41 (1993).
Bak, P. How Nature Works—The Science of Organised Criticality (Oxford Univ. Press, Oxford, 1977).
Rhodes, C. J. & Anderson, R. M. Power laws governing epidemics in isolated populations. Nature 381, 600–602 (1996).
Office of Population Censuses and Surveys Registrar General's Weekly Return for England and Wales (Her Majesty's Stationery Office (HMSO), London, 1944–94).
Hall, P. & Patil, P. Properties of nonparametric estimators of autocovariance for stationary random fields. Prob. Theor. Relat. Fields 99, 399–424 (1994).
Bjørnstad, O. N. & Falck, W. Nonparametric spatial covariance functions: estimation and testing. Environ. Ecol. Stat. 8, 53–70 (2001).
Bjørnstad, O. N., Finkenstädt, B. & Grenfell, B. T. Dynamics of measles epidemics. I. Estimating scaling of transmission rates using a time series SIR model. Ecol. Monogr. (in the press).
May, R. M. & Anderson, R. M. Spatial heterogeneity and the design of immunization programs. Math. Biosci. 72, 83–111 (1984).
Acknowledgements
We thank S. Cornell, T. Coulson, J. Gog, M. Keeling, A. Lloyd, G. Nason, P. Rohani, C. Torrence and C. Williams for helpful discussions. B.T.G. and J.K. were supported by the Wellcome Trust. O.N.B. was supported by the National Center for Ecological Analysis and Synthesis (a Centre funded by an NSF grant, the University of California Santa Barbara, and the State of California) and the Norwegian Science Foundation.
Author information
Authors and Affiliations
Corresponding author
Supplementary information

Figure I
(GIF 9.32 KB)
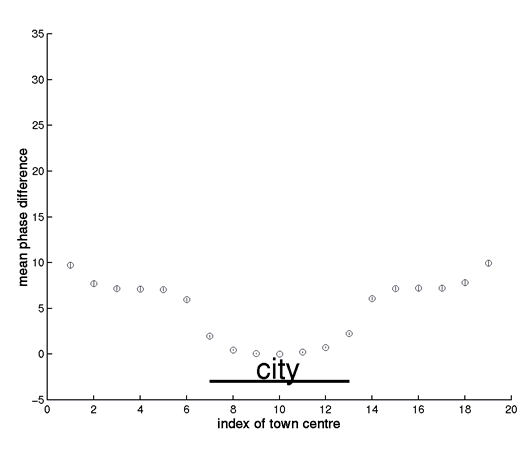
The figure (which accompanies Box 2, figure a) shows the mean (+/s.e.) biennial wavelet phase of 60 simulations of the spatial TSIR model with small centres, defined in Box 2 of the paper. To explore the phase relationships arising from approximately phase-locked biennial cycles, the simulations were run for 10 years, starting from the phase-locked deterministic attractor of the system.
Notes
-
1.
The phase lag is not an ‘edge’ effect, since wrapped boundary condition also generate a phase lag near the city.
-
2.
As we move away from the city, note that the phase error bars widen. This is partly due to greater irregularity nearer the edge, but also partly because occasional simulations drop onto the opposite attractor (with 180o phase lag). As noted in Box 2, this partly reflects distance from the city, but also a genuine edge effect (note that Norwich and its environs are near the coast, hence an ‘edge’ in terms of measles transmission).
-
3.
Previous work (Bjørnstad et al. 2001, op. cit.) shows that the relative measles transmission rate (Ro) in the England and Wales data set is constant across 3 orders of magnitude of population size. In fact, the crude models used here show slight increases in transmission rate with coupling (because tight coupling in the crude way we have defined it can increase Ro).
This is illustrated in Figure (II), which presents a phase analysis of the case when large centres are coupled (cf Box 2, figure (b) in the paper). Increased coupling between boroughs increases their effective Ro and causes them to lead the ‘periphery’ slightly, by 1 time step (2 weeks) – note also that the phase analysis picks up this small phase lag more sensitively than the crude plot of average biennia in Box 2.
This effect – which is a byproduct of our coupling model, cannot cause the progressive phase lag of the periphery seen in Figure (I); this latter is driven by ‘sparks’ of infection in the hierarchical system, as described in Box 2. However, the effect of coupling on effective transmission does complicate the analysis of the relationship between waves and coupling. We are currently exploring this issue: preliminary analyses indicate that hierarchical waves will occur at a range of ‘intermediate coupling rates, as long as the overall dynamics are biennial and major epidemics occur in the same year. Recent work (1) indicates that a more mechanistic representation of coupling can remove the spurious slight increase in R0 in tightly-coupled centres.
(1) Keeling, M.J. & Rohani, P. (2001) Spatial Coupling in Epidemiology: A Mechanistic Approach. Ecol. Letts. (in press).

Structure of the movie frame
The movie shows the dynamics of measles in England and Wales during the period 1955-1965. The data are from the Registrar General's weekly notifications of measles in 954 urban locations; the movie plots a frame every 2 weeks.
The upper left quadrant shows observed measles dynamics, using colour coding for the logarithm of the number of reported infected cases (all data are scaled on (0-1) before plotting). Zero case reports are shown as white circles and circle size is proportional to {population size}0.2. The movie captures the overall synchonised biennial 'pulse' of measles epidemics, superimposed on the seasonal swing of infection. There are also more irregular epidemics in smaller places and many other interesting patterns, for example distinctive behaviour in many coastal towns.
The observed data also show travelling waves of measles, moving away from large centres such as London. These are revealed more clearly in the upper right quadrant, which shows the smoothed major epidemic cycles, filtered using wavelets in a window of 1.75 to 3 years. As discussed in the paper, the filtered series reveal dramatic waves of measles, moving away from large centres, especially London and the North West conurbation. The lower left quadrant shows the phase difference from London of these filtered series (see the paper for more details). The arrows and the colour of the arrows are indicators of the phase difference, as shown on the circular key (green denotes a zero phase difference from London, blue denotes a lag and yellow a lead). These give a more stable picture of the phase relationships -- notably, the wave moving away from London and a relatively early wave from the North West. Finally, the lower right quadrant plots a moving time bar against the London and Manchester series.
Running the movie after download
The format of the movie is flic, because it allows for high compression of the data. You can watch the movie in a variety of players - for example, Quicktime or the freeware Autodesk player AAwin.
Click here to download the Quicktime plugin >>> http://www.apple.com/quicktime/download/
Rights and permissions
About this article
Cite this article
Grenfell, B., Bjørnstad, O. & Kappey, J. Travelling waves and spatial hierarchies in measles epidemics. Nature 414, 716–723 (2001). https://doi.org/10.1038/414716a
Received:
Accepted:
Published:
Issue Date:
DOI: https://doi.org/10.1038/414716a
This article is cited by
-
Anticipating epidemic transitions in metapopulations with multivariate spectral similarity
Nonlinear Dynamics (2023)
-
North to south gradient and local waves of influenza in Chile
Scientific Reports (2022)
-
Sars-Cov2 world pandemic recurrent waves controlled by variants evolution and vaccination campaign
Scientific Reports (2022)
-
Urban Scaling of Health Outcomes: a Scoping Review
Journal of Urban Health (2022)
Comments
By submitting a comment you agree to abide by our Terms and Community Guidelines. If you find something abusive or that does not comply with our terms or guidelines please flag it as inappropriate.
