
Figures, tables and video
From the following article
Electrophysiologic characterization of the swallowing pattern generator in the brainstem
André Jean and Michel Dallaporta
GI Motility online (2006)
doi:10.1038/gimo9
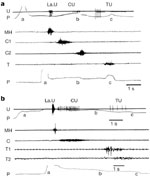
Figure 1
Swallowing motor pattern and sequential activity of vagal motor fibers in species with striated (a, sheep) or striated and smooth muscle (b, baboon) esophagus.
Full size figure and legend (45K)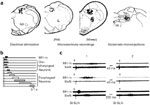
Figure 2
Brainstem swallowing sites and activity of swallowing neurons.
Full size figure and legend (73K)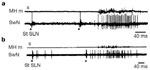
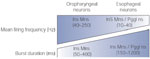
Figure 4
Diagram showing the opposite gradients in the firing frequency and the burst duration of the different types of swallowing neurons.
Full size figure and legend (27K)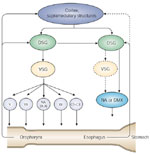
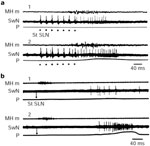
Figure 6
Effect of sensory inputs on the burst discharge of swallowing neurons.
Full size figure and legend (56K)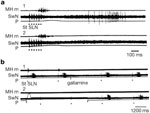
Figure 7
Inhibitory effects on the burst firing of swallowing neurons.
Full size figure and legend (43K)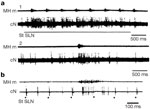
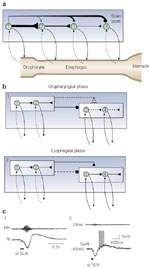
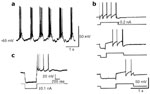
Figure 10
Cellular properties of NTS neurons recorded in vitro on rat brainstem slices.
Full size figure and legend (36K)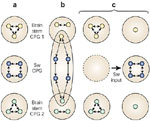
Figure 11
Schematic representations of the swallowing central pattern generator (CPG).
Full size figure and legend (60K)
Table 1
Nucleus tractus solitarius (NTS) subnuclei mainly involved in oropharyngeal and esophageal phases of swallowing as revealed by microelectrode recordings or c-fos experiments
Full size table and legend