Figures, tables and video
From the following article
Signal transduction in lower esophageal sphincter circular muscle
Piero Biancani and Karen M. Harnett
GI Motility online (2006)
doi:10.1038/gimo24
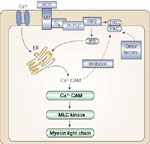
Figure 1
Signal transduction for lower esophageal sphincter (LES) contraction in response to agonists.
Full size figure and legend (25K)
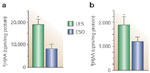
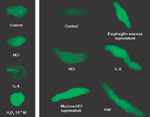
Figure 3
[3H]Arachidonic acid (AA) content and release of LES and esophageal circular smooth muscle.
Full size figure and legend (14K)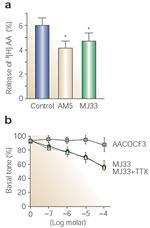
Figure 4
Secreted phospholipase A2 (sPLA2) inhibitors and [3H]AA release and LES tone.
Full size figure and legend (20K)
Figure 5
Cyclooxygenase or lipoxygenase inhibitors and LES basal tone.
Full size figure and legend (14K)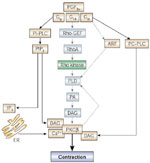
Figure 6
Prostaglandin F2 (PGF2)-induced protein kinase C (PKC) activation in LES tone and sustained contraction.

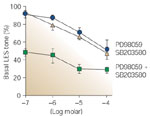
Figure 8
Mitogen-activated protein (MAP) kinases mediate PKC-dependent LES basal tone.
Full size figure and legend (14K)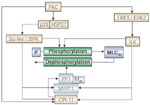
Figure 9
Protein kinase C (PKC)-mediated contraction of LES circular muscle.
Full size figure and legend (19K)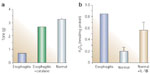
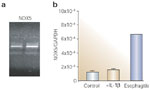
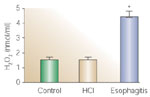
Figure 11
Nicotinamide adenine dinucleotide phosphate (NADPH) oxidase in esophagitis.
Full size figure and legend (15K)