
Figure 3 - The odds ratio (95% confidence intervals) for prevalence of H. pylori in patients with esophagitis in North America24, 25, 26, 27, 28, 29, 30 and the Far East.19, 20, 21, 22, 23
From the following article
Pathophysiology of gastroesophageal reflux disease
Nicholas E. Diamant
GI Motility online (2006)
doi:10.1038/gimo21
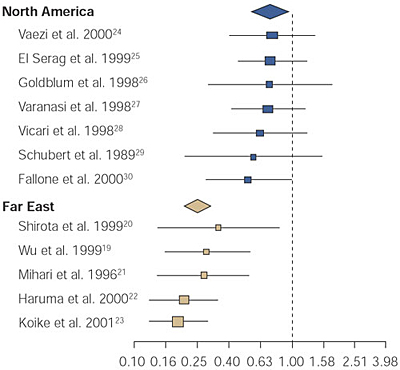
The large diamonds represent the summary odds ratio for each geographic area. The largest boxes represent studies with large sample sizes. (Source: Pandolfino et al.6, with permission from Blackwell Publishers.)
Powerpoint slides for teaching
If the slide opens in your browser, Select "File > Save as" to save it.
Download Power Point slide (369K)