
Abstract
Image registration of biological data is challenging as complex deformation problems are common. Possible deformation effects can be caused in individual data preparation processes, involving morphological deformations, stain variations, stain artifacts, rotation, translation and missing tissues. The combining deformation effects tend to make existing automatic registration methods perform poor. In our experiments on serial histopathological images, the six state of the art image registration techniques, including TrakEM2, SURF + affine transformation, UnwarpJ, bUnwarpJ, CLAHE + bUnwarpJ and BrainAligner, achieve no greater than 70% averaged accuracies, while the proposed method achieves 91.49% averaged accuracy. The proposed method has also been demonstrated to be significantly better in alignment of laser scanning microscope brain images and serial ssTEM images than the benchmark automatic approaches (p < 0.001). The contribution of this study is to introduce a fully automatic, robust and fast image registration method for 2D image registration.
Introduction
Image registration is the process of transforming different sets of data into one coordinate system and elastic image registration is potentially an enabling technology for the effective and efficient use of many image-guided diagnostic and treatment procedures, which rely on multimodality image fusion or serial image comparison. The use of elastic image registration covers a wide variety of medical applications, from building anatomical atlases, to longitudinal studies of tumor growth or other disease processes, through surgical planning and guidance1,2,3,4. Consequently, it is a creative field of research; techniques are numerous and inspired from a wide range of theories or techniques, such as statistics, information theory, theory of continuum mechanics, theory of thermodynamics, optical flow, splines, wavelets and block matching and there are a number of reviews of biomedical image registration techniques and applications5,6,7.
The histopathological study of tissue is an important tool in the medical field for the prognosis of disease. Conventionally, histological slides are examined under an optical microscopy to reveal two dimensional images. However, this method is insufficient to analyze complex three dimensional histology of lesion or tumor. By registering consecutive slices of biological images, 3D histology reconstruction can be generated8. In 2010, Peng et al.9 introduced a Vaa3D system for real-time visualization of a three-dimensional digital atlas of neurite tracts in the fruitfly brain. Another useful application is multimodal molecular mapping, requiring the joint analysis of two-dimensional gene and protein expression maps (obtained from in situ hybridization and immunohistochemistry, respectively) and/or their local comparison against cellular morphology maps (from histology)10. 3D reconstruction and visualization of microscopic images makes it possible to provide medical doctors and biologists a rapid and precise data set about the patients or animals regarding the micro-environment and topology in the tissue or organ potentially involved in certain diseases or biological functions.
Serial slides can be manually aligned by setting up a number of pairs of corresponding control points to the same (x, y) location for consecutive images zi and zi+1 and the pairs of images and paired-sets of control points are then given to semi-automatic software11 for image alignment. Fully automatic registration of biological images is possible as demonstrated by software TrakEM212,13,14,15 and in various studies8,10,16,17,18. However, 3D reconstruction of histopathological data is challenging. Cardona et al.12 pointed out that “TrakEM2 acknowledges that any automatic procedure (such as image registration and image segmentation) will eventually fail partially or fully and will require manual correction by a human operator”. In comparison to the CT scans or confocal images as used in the studies9,18 where the serial image data maintains the property of geometrical continuity in 3d space, there are complex deformation problems for serial histopathological slides, including physical destructions caused by cutting and fixation, staining artifacts and uneven stain variations due to potential discrepancy in thickness of individual tissue sections. These complex distortion effects makes image registration of histological data a difficult task (see Figure 1). In previous studies8,10,14,15,16,17,19, the raw data tends to be carefully prepared, showing little morphological distortions or stain variation, to simplify the registration task. In addition, they tend to work with low resolution images without dealing with high precision tissue or cell level registration. Figure 2 illustrates possible deformation problems caused in individual data preparation processes, involving morphological deformations, stain variations, stain artifacts, rotation, translation and missing tissues. The combining deformation effects tend to make existing automatic registration methods perform poor.

Image registration of histopathological images is difficult.
Image registration is the process of transforming different sets of data into one coordinate system, but for registering histopathological images, there are challenging morphological deformation problems (as displayed in the left pair) in combination with staining variation and staining artifacts (as illustrated in the right pair).

Challenges of registration of histopathological images.
The challenges of registration of histopathological images include complex geometrical deformation and stain variations induced from individual data preparation steps.
The main contribution of this study is to introduce a fully automatic and robust image registration method that is able to deal with complex deformation problems commonly found in biological imagery. For evaluation, three types of data are utilized, including 47 pairs of serial histopathological images, 30 laser scanning microscope images18 and 30 serial ssTEM images14. The 47 pairs of serial histopathological images were collected under routine sample preparation procedures in hospitals, showing the above-mentioned deformations. The proposed method is compared with six existing image registration techniques, including an elastic b-spline model for biological images (UnwarpJ)20, an improved bi-directional b-spline model for histopathological section alignment (bUnwarpJ)21, a popularly adopted image registration approach (SURF + affine transformation)22,23, a serial section registration approach14 using the software package (TrakEM2)12,13,14,15, BrainAligner18 and a combination of a local contrast correction method (CLAHE)24 and bUnwarpJ. The results show that the existing image registration techniques perform poorly on the serial histopathological data with deformations and achieve less than the accuracy 70% on average while the proposed method achieves the averaged accuracy 91.49%. In alignment of laser scanning microscope brain images18, the results show that the proposed method is significantly better than the automatic BrainAligner18 (p < 0.001). In registration of serial ssTEM images14, the proposed method is also significantly better than TrakEM214 (p < 0.001).
This work combines and extends our previous efforts published in Wang and Chen25, which integrates the strengths of area-based and feature-based approaches and uses sparse approximation for coarse and fast global registration to greatly improve the performance of image registration. As we observed that data normalization and feature enhancement are vital for the following global feature-based registration and local area-based registration, we further improve the registration method by modifying the data normalization and feature enhancement parts. The proposed method is able to not only reduce global and local variations among slides but also effectively identify corresponding features and with accurately identified landmark features and normalized data, the method produces valid registration outputs robust to various deformation problems commonly occurred in biological data, such as morphological distortions, staining variations, staining artifacts and loss of tissue.
Results
Serial histopathological image registration
47 pairs of consecutive slides were collected under routine sample preparation procedures in hospitals using C57 mice with IgAN (Immunoglobulin A (IgA) nephropathy), which is the most common glomerular disorder across the world26. IgAN was induced by daily injection of purified IgA anti-phosphorylcholine and pneumococcal C-polysaccharide (PnC)27 and all animal experiments were performed with the approval (permit number IACUC-11-063) by the institutional animal care and use Committee of the national defense medical center, Taiwan. The tissues were fixed in 10% buffered formalin and embedded in paraffin and serial sections (4 μm) were cut using Leica RM2155 and stained with hematoxylin and eosin (H&E). Images were then captured from glass slides with standard brightfield light microscopy (Olympus, Japan) at the magnification of 400×.
Regarding the evaluation method, as pointed out in a recent study25 that conventional evaluation methods based on sum of squared differences (SSD) of image intensities between the target and the transformed source (see Equation 1) to represent the registration accuracy level can be misleading for tissue image applications not only because that the intensity value of the pixel in the target and the one of the wrongly registered pixel in the transformed source may appear similar due to similarity of local tissue image features but also because that the intensity of the pixel in the target and the one of the accurately registered pixel in the transformed source may appear different due to stain variation. Hence, the quantitative evaluation approach of the previous work25 is adopted; five corresponding landmarks between target images and associated transformed source images by each registration method were firstly manually marked by experienced pathologists and an automatic matching system is built to compare the coordinates of the corresponding landmarks. The registration accuracy for each image pair is computed by the matching successful rate over the corresponding landmarks (within a five pixel distance) and the performance of each registration method is evaluated by the averaged accuracies over all image pairs.
Table 1 presents the quantitative evaluation results on registration accuracies. The benchmark approaches13,14,15,20,21,22 all perform poor, achieving less than 70% accuracy on average and hence manual intervention are frequently required for accurate alignment. In comparison, the proposed method obtains registration accuracy (91.49%), greatly outperforming the benchmark methods and showing slight improvements than the author's previous work25. Using SPSS software28, the statistical analysis results in Table 2 show that the proposed method is significantly better than the benchmark techniques13,14,15,20,21,22 (p < 0.01) based on the Fisher's Least Square Difference test (LSD). Figure 3 presents the box plot of the quantitative scores, showing that the presented method frequently achieves higher scores than the benchmark methods. Figure 4 illustrates the quantitative evaluation results of alignment of the left image pair in Figure 1, showing that the proposed method (Fig. 4(h)) aligns the images well, achieving 100% matching score while the benchmark methods perform poor due to complex deformation problems, staining variations and confusing local image features of biological data. Figure 5 shows another image registration example by the proposed method and the benchmark techniques. For the benchmark methods, the parameters adopted in the experiments are the same parameters used in the reference works14,20,21 and the parameter values are listed in the method section.

A box plot of quantitative evaluation results of histopathological image registration.
The presented method works constantly well overall and outperforms the benchmark approaches (see Table 1). Outliers > 1.5 × interquartile range are marked with a dot and outliers > 3 × interquartile range are marked with an asterisk.

Quantitative evaluation of image registration for the left image pair in Figure 1.
The blue rectangles represent the locations of the selected landmarks defined by experienced pathologists in the target image(a); the red boxes represent mismatches of corresponding landmarks in the transformed source image; the green boxes represent matches of corresponding landmarks in the transformed source image. There is no match for the transformed source images by (c)UnwarpJ, (d) bUnwarpJ and (e)SURF and only one match for (f)TrakEM2. In comparison, the proposed method(g) aligns the images well, achieving 100% target and transformed source matching successful rate.

Performance comparison on registration methods.
Existing image registration methods perform poor on the histopathological image pair with complex distortion problems while the proposed method is able to produce a valid transformation output. (a) the transformed source image of an elastic b-spline method20 designed for biological images, (b) the output of a bi-directional b-spline approach21, (c) the transformed source image by CLAHE24 + bUnwarpJ, (d)the registration output of a popularly adopted registration method, i.e. SURF22, (e) the output of TrakEM212,13,14,15, (f) the transformed source image of the proposed technique.
Laser scanning microscope images of neurons from different brains
BrainAligner18 is an automatic computer program that registers pairs of 3D image stacks using landmark matching. In registration of the histopathological images, BrainAligner fails to produce valid alignment outputs. We further compare the performance of the proposed method and BrainAligner based on the data used in the BrainAligner study18. The test data are 30 laser scanning microscope images of the Drosophila and downloaded from http://penglab.janelia.org/proj/brainaligner/BrainAligner/Download.html. Regarding the parameters used in BrainAligner, all parameters are based on the system default settings. For fully automatic registration (without inputs of the manually marked corresponding landmarks), both global and local registration types are tested in the experiments.
Unlike histopathological images, local image features of laser scanning brain images appear less confusing to one another and therefore a general registration performance measurement method, i.e. the percentage of pixels with similar intensity levels, is adopted to measure the registration accuracy and an automatic evaluation tool is built to conduct quantitative evaluation automatically. The registration accuracy, r, is formulated as follows.
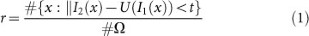
where I1, I2, U(I1) represents the source, target and transformed source images;  defines a mask common to the source and target images and #Ω is the size of the mask in pixels; t = 30 in our experiments.
In our experiments, it is observed that with manually marked corresponding landmarks between the source and target images, semi-automatic BrainAligner performs well. However, without manually predefined landmarks, fully-automatic BrainAligner does not produce good registration outputs. In comparison, the proposed fully automatic method without manual inputs performs well. The registration accuracy scores are summarized in Table 3 and the statistical analysis of LSD test is displayed in Table 4, showing that the presented fully-automatic method is significantly better than the fully-automatic BrainAligner (p < 0.001). The notable advantage of the presented method is to save costs of manual efforts and time in labelling landmarks. Figure 6 presents the box plot of the registration accuracy scores, showing that the presented method frequently achieves high scores in comparison to the benchmark approaches. Figure 7 displays the registration outputs of six image pairs by the proposed fully-automatic method, the fully-automatic BrainAligner and the semi-automatic BrainAligner (with manually predefined landmarks).

A box plot of registration accuracy scores on laser scanning brain images from BrainAligner study18.
100 indicates that the method accurately align the target and source images and 0 indicates poor registration.

Registration of brain images by brainAligner and proposed method.
The brainAligner performs well with predefined landmarks but poor without predefined landmarks. In comparison, the proposed method without predefined landmarks produces accurate alignment outputs. (a) the target brain images, (b) the source brain images, (c) the registered source images by the proposed method (cw-R), (d) the registered source images by brainAligner without predefined landmarks (under the local registration mode), (e) the registered source images by brainAligner without landmarks (under the global registration mode), (f) the registered source images by brainAligner with predefined landmarks.
A comparison on computational speed among the proposed method, the semi-automatic BrainAligner and the fully-automatic BrainAligner is shown in Figure 8. The processing time for the semi-automatic BrainAligner does not include the time for the manual marking of corresponding landmarks as this information is unknown in this study. Since the manual marking time is often lengthy, therefore the processing time by the semi-auto BrainAligner might be greatly underestimated. Comparing the automatic approaches, on average the proposed method takes 3.79 second per registration while the automatic BrainAligner with the local registration mode costs 22.93 second per registration on average and the automatic BrainAligner with the global registration mode costs 52.32 second per registration on average. In statistical analysis, the presented method is significantly faster than the automatic BrainAligner approach (p < 0.001 based on Tukey HSD and LSD tests).

A box plot of the image registration processing speed on the brain images.
The processing time (in seconds) on brain image registration by the proposed method, the semi-automatic brainAligner and the automatic brainAligner. The processing time for the semi-automatic brainAligner does not include the time for manually marking corresponding landmarks as this information is unknown in this study. Since the manual marking time is often lengthy, therefore the processing time by the semi-automatic brainAligner is greatly underestimated. Comparing the automatic approaches, the proposed method is significantly faster than the brainAligner approach (p < 0.001 based on Tukey HSD and LSD tests) and costs 3.79 second per registration.
Serial section transmission electron microscopy (ssTEM) of drosophila neural tissue
We have also compared the performance of the proposed method and TrakEM2 based on the data used in the TrakEM2 study14. The test images are 30 serial ssTEM sections of the Drosophila first instar larva ventral nerve cord (VNC) and downloaded from http://www.ini.uzh.ch/~acardona/data.html. In evaluation, the general registration performance measurement method, i.e. the percentage of pixels with similar intensity levels, is adopted to measure the registration accuracy (see Equation 1).
Figure 9 displays registration results of six pairs of ssTEM images by the proposed method and TrakEM2; row (a) and (b) show target images and source images, respectively and row (c) and (d) present registered source images by the proposed method and TrakEM2, respectively. It is observed that in this data set, there is no distinctive morphological deformation between the target images(a) and the source images(b), but illumination variations between the source and the target can be large, which tends to make the overall registration scores lower in comparison to the BrainAligner data set. In the second column of Figure 9, it shows that TrakEM2 generates poorer alignment output(d) than the proposed method(c). Figure 10 displays the box plot of the registration accuracy scores by the proposed method and TrakEM2, showing that the proposed method tends to obtain higher scores than TrakEM2. Moreover, using ANOVA analysis, the proposed method is significantly better than TrakEM2 in image registration of serial ssTEM images (p < 0.001).

Registration of ssTEM images by TrakEM2 and the proposed method.
(a) the target images, (b) the source images, (c) the transformed source images by the proposed method (cw-R), (d) the transformed source images by TrakEM2.

A box plot of registration accuracy scores on ssTEM images from TrakEM2 study14.
100 indicates that the method accurately align the target and source images and 0 indicates poor registration.
Discussion
We present a fully automatic elastic registration method for aligning 2D tissue images robust to morphological distortions, staining variations and staining artifacts. In addition, the presented method for detection of corresponding landmarks works reliably without manual intervention and the presented image registration algorithm is not only limited to histopathological slides but can also be applied to other anatomically or histologically defined biological images such as laser scanning microscope brain images and serial ssTEM images. Moreover, as complex deformations are unavoidable in real life data, the presented technique will prove to be a substantial advantage for any application that requires image registration. We have integrated our method into a public Java-based image processing system, ImageJ29 and the software is made publicly available (http://www-o.ntust.edu.tw/~cweiwang/ImageRegistration/), allowing the scientific community to download and use the robust image registration system (Cw-R).
Methods
This paper presents a fully automatic, robust and fast registration method that integrates the strengths of both area-based approaches and feature-based methods for biological data, containing three main parts: (1) improved data normalization and feature extraction, (2) sparse approximation of images for coarse and fast global registration, (3) Optimize and refine local registration by area-based direct matching approach. This work combines and extends our previous efforts published in Wang and Chen25 and the improvement is made on the first part, which is improved data normalization and enhanced feature extraction. In this section, descriptions are focused on the modified part and other parts can be found in the previous publication25.
Improvements on data normalization and image feature extraction can not only help identify more effective corresponding feature pairs for global registration but also boost up the performance of area-based local registration. Figure 11 shows the results of detection of corresponding feature pairs by SURF, SIFT, the author's previous work25 and the proposed method, showing that (a)SURF produces poor matching, (b)SIFT generates some incorrect matches and (d)the proposed method find more accurately-matched corresponding feature pairs for fast and higher level coarse registration than (c)the author's previous work25.

Detection of corresponding features by SURF, SIFT, the author's previous work25 and the proposed method.
(a)SURF produces poor matching, (b)SIFT generates some incorrect matches and (d)the proposed method find more accurately-matched corresponding feature pairs for fast and higher level coarse registration than (c)the author's previous work.
Improved data normalization and feature extraction
An improved data normalization process is proposed to reduce variations on image features and enhance tissue patterns. This greatly benefits global feature matching and local area-based directing matching processes. It automatically optimizes the brightness and contrast of individual color channels based on the analysis of the image histogram distribution. Furthermore, as common contrast stretching algorithms are sensitive to spike, ridges or long tails problems at the tails of the histogram distribution and unable to detect the dynamic range of the main cluster, a modified method is presented here to effectively identify the dynamic range of the main cluster and deal with spike, ridges or long tails problems. Figure 12 presents (a) a raw tissue image with long tail problem, (b) the image generated by a commonly adopted auto contrast adjustment method (using Adobe Photoshop) and (c) the image by the presented data normalization method. Figure 12 shows that tissue image features such as nuclear patterns are greatly enhanced by the presented method.

Comparison of data normalization methods.
The proposed data normalization method is able to deal with spike, ridges or long tails problems at the tails of the histogram distribution and effectively enhance tissue patterns. (a) a raw tissue image with long tail problem, (b) image by a commonly adopted auto contrast adjustment method (Adobe Photoshop is used here), (c) image by the presented data normalization method where tissue image features such as nuclear patterns are enhanced.
In conventional histopathological staining (H&E), Hematoxylin induces the blue staining of nuclei and Eosin induces the red/pink staining of cytoplasm. Based on our previous study30 showing that applying histogram equalization in RGB color space performed better in separating the nuclei from the cytoplasm than in HSL color space, both to enlarge the difference between the nuclear and cytoplasmic expression in color space and to further produce more distinctive tissue image features, the normalization is applied to the Red, Green and Blue components of each image.
In color images, the value of each pixel is represented by a vector  with elements the pixel values of each color component. Assuming
 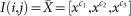 a random vector, which models the pixel value for each color component c1, c2, c3 in a color image. Firstly, the lower and the upper bound intensity levels of the histogram of each channel, xlow and xhigh, are computed by the equations below. Given a histogram distribution H, where H(x) is the number of pixels with intensity level x, the lower and the upper bound values for transformation are formulated as follows.

where cj: {c1, c2, c3}, α = 0.1 and β = 0.002.
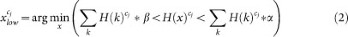
Next, it maps the original pixel value  in the range from
  to
to  to new value
  in the valid intensity scale from
  to
to  .
.
The data normalization greatly reduces stain variation and enhances tissue patterns, assisting the following feature extraction model to identify valid corresponding landmarks and improving image registration outcomes. An illustration is given in Figure 13; (a) the source image, (b) the target image, (c) and (d) are the images applied with the presented data normalization method with automatically identified corresponding landmarks, (e) and (f) are images with deformation grid, (g) is the deformation field and (h) is the transformed source image that is well aligned to the target image. The tissue patterns of the images applied with the presented data normalization method are greatly enhanced, assisting the following feature extraction model to identify valid corresponding landmarks and improving image registration outcomes.

Illustration of the proposed data normalization method.
The proposed data normalization method enhances tissue patterns, reduces stain variation and assists the following identification of corresponding landmarks and image registration. (a) the source image, (b) the target image, (c) and (d) are the images applied with the presented data normalization method with automatically identified corresponding landmarks, (e) and (f) are images with deformation grid, (g) is the deformation field and (h) is the transformed source image that is well aligned to the target image.
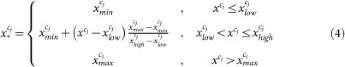
For biological images, although the dyes used are visualized as having different colors, the resulting stains actually have complex overlapping absorption spectra. In the previous studies, color deconvolution was used to achieve color separation in forensic image processing31 and to achieve stain separation32,33 in biological image processing. Our goal is to extract the eosinophilic structures, which are generally composed of intracellular or extracellular protein, as image features for image registration and the color decomposition technique is utilized to extract independent haematoxylin and eosin stain contributions from individual histopathological images using orthonormal transformation of RGB.
In the RGB color-space, every color is defined as  where r, g, b represent the red, green and blue components and we can see additive color mixing as the vector addition of RGB components. To model the colors in an image as the vector addition of a desired (D) and undesired (U) components to a background color (P), new unit vectors can be defined as follows.


where  is perpendicular to
  and
and  ;
;  ,
,  ,
,  span the 3D space;
  and
and  are alternative unit vectors based on the undesired and desired colors.
Then, color  can be transformed to the new unit vectors.

where  ; O is the origin in the RGB 3D space;
  is a vector.
By setting u = 0, we remove the undesired component and obtain the new color  . In the case of three channels, the color system can be described as a matrix of the form with every row representing a specific stain and every column representing the optical density (OD) as detected by the red, green and blue channel for each stain.

For normalization, each OD vector is divided by its total length, such that ( ,
,  and
and  ). In this study, the normalized optical density (OD) matrix,
  , to describe the color system for orthonormal transformation is defined as follows:

When C is the 3 × 1 vector for amounts of the stains at a particular pixel, the vector of OD levels detected at that pixel is equal to  . Therefore, multiplication of the OD image with the inverse of OD matrix results in orthogonal representation of the stains forming the image (
 ). Then, the image features of the red channel are extracted as eosinophilic structures for both high level feature-based coarse registration and local area-based direct matching registration.
Parameter values used in the experiments
For the benchmark methods, the parameters used in the experiments are the default parameters in the implementations of the reference works14,20,21 and they are the same parameters as used in the previous studies14,20,21. The values of the parameters for the benchmark methods and the proposed method are listed below.
UnwarpJ parameter values
Initial deformation = Very Coarse, Final deformation = Fine, Divergence weight = 0.0, Curl Weight = 0.0, Landmark Weight = 0.0, Image Weight = 1.0, Stop Threshold = 0.01.
bUnwarpJ parameter values
Registration Mode = Accurate, Initial deformation = Very Coarse, Final deformation = Fine, Divergence weight = 0.0, Curl Weight = 0.0, Landmark Weight = 0.0, Image Weight = 1.0, Stop Threshold = 0.01.
TrakEM2 parameter values
mode = least squares (linear feature correspondences). For Scale Invariant Interest Point Detector, initial gaussian blur = 1.60px, Steps per scale octave = 3, minimum image size = 64px, maximum image size = 600px. For Feature Descriptor, feature descriptor size = 8, feature descriptor orientation bins = 8, closest/next closest ratio = 0.92. Maximal alignment error = 100px, minimal inlier ratio = 0.2, minimal number of inliers = 7, expected transformation = rigid, tolerance = 0.5px. Desired transformation = Rigid, correspondence weight = 1.00. In optimization, maximal iterations = 2000, maximal plateauwidth = 200, mean factor = 3.00.
SIFT parameter values used in the proposed method
initial gaussian blur = 1.05px, Steps per scale octave = 3, minimum image size = 64px, maximum image size = 1024px, feature descriptor size = 4, feature descriptor orientation bins = 8, closest/next closest ratio = 0.92, maximal alignment error = 30px, minimal inlier ratio = 0.05, minimal number of inliers = 7, expected transformation = rigid.
Software and test images
The developed software is platform independent and thus can be executed in different operation systems such as Windows, Linux or Mac. The software with some test images can be downloaded from the author's website (http://www-o.ntust.edu.tw/~cweiwang/ImageRegistration/).
References
Mosconi, L. Brain glucose metabolism in the early and specific diagnosis of Alzheimer's disease. FDG-PET studies in MCI and AD. Eur. J. Nucl. Med. Mol. Imaging. 32, 486–510 (2005).
Maintz, J. B. A. & Viergever, M. A. A survey of medical image registration. Med. Image Anal. 2, 1–36 (1998).
Cachier, P. Recalage non rigide d'images medicales volumiques - contribution aux approches iconiques et geometriques. Ph.D. Thesis, Ecole Centrale des Arts et Manufactures (2002).
Hill, D., Batchelor, P., Holden, M. & Hawkes, D. Medical image registration. Phy. in Med. and Biol. 3, R1–45 (2001).
Makela, T. et al. A review of cardiac image registration methods. IEEE Trans. Med. Imag. 21, 1011–21 (2002).
Oliveira, F. P. & Tavares, J. M. Medical image registration: a review. Comput. Methods Biomech. Biomed. Engin. 17, 79–93 (2014).
Zitova, B. & Flusser, J. Image registration methods: a survey. Imag. Vis. Comput. 21, 977–1000 (2003).
Tan, Y., Hua, J. & Dong, M. 3D reconstruction from 2D images with hierarchical continuous simplices. Visual Comput. 23, 905–914 (2007).
Peng, H. et al. V3D enables real-time 3D visualization and quantitative analysis of large-scale biological image data sets. Nat. Biotechnology 28, 348–53 (2010).
Pitiot, A. & Guimond, A. Geometrical regularization of displacement fields for histological image registration. Med. Image Anal. 12, 16–25 (2008).
Fiala, J. C. Reconstruct: a free editor for serial section microscopy. J. Microscopy 218, 52–61 (2005).
Cardona, A. et al. An Integrated Micro- and Macroarchitectural Analysis of the Drosophila Brain by Computer-Assisted Serial Section Electron Microscopy. PLoS Biology 8, e1000502 (2010).
Cardona, A. et al. TrakEM2 Software for Neural Circuit Reconstruction. PLoS ONE 7, e38011 (2012).
Saalfeld, S., Cardona, A., Hartenstein, V. & Tomancak, P. As-rigid-as-possible mosaicking and serial section registration of large ssTEM datasets. Bioinfo. 26, i57–i63 (2010).
Saalfeld, S., Fetter, R., Cardona, A. & Tomancak, P. Elastic volume reconstruction from series of ultra-thin microscopy sections. Nat. Methods 9, 717–720 (2012).
Chakravarty, M. et al. The creation of a brain atlas for image guided neurosurgery using serial histological data. NeuroImage 30, 359–376 (2006).
Dauguet, J. et al. Three-dimensional reconstruction of stained histological slices and 3D non-linear registration with in-vivo MRI for whole baboon brain. Kidney Int. 164, 191–204 (2007).
Peng, H. et al. BrainAligner: 3D registration atlases of Drosophila brains. Nat. Methods 8, 493–498 (2011).
Alic, L. et al. Facilitating tumor functional assessment by spatially relating 3D tumor histology and in vivo MRI image registration approach. PLoS One 6, e22835 (2011).
Sorzano, C., Thevenaz, P. & Unser, M. Elastic Registration of Biological Images using Vector-Spline Regularization. IEEE Trans. Biomed. Engin. 52, 652–663 (2005).
Arganda-Carreras, I. et al. Consistent and Elastic Registration of Histological Sections using Vector-Spline Regularization. LNCS, Comput. Vis. Approaches to Med. Imag. Anal. 4241, 85–95 (2006).
Bay, H., Ess, A., Tutelaars, T. & Gool, L. Speeded Up Robust Features (SURF). Comput. Vis. Imag. Understand. 110, 346–359 (2008).
Kroon, D. OpenSURF (including Image Warp). http://www.mathworks.com/matlabcentral/fileexchange/28300-opensurf-including-image-warp (2010) Date of access:01/08/2012.
Saalfeld, S. CLAHE (Contrast Limited Adaptive Histogram Equalization). http://rsbweb.nih.gov/ij/plugins/clahe/index.html (2009) Date of access:1/8/2012.
Wang, C. & Chen, H. Improved Image Alignment Method in application to X-ray Images and Biological Images. Bioinfo. 29, 1879–1887 (2013).
D'Amico, G. The commonest glomerulonephritis in the world IgA nephropathy. Q. J. Med. 65, 709–727 (1987).
Chao, T. K. et al. The endogenous immune response modulates the course of IgA-immune complex-mediated nephropathy. Kidney Int. 70, 283–297 (2006).
SPSS Inc. SPSS for Windows, Rel.17.0.1. 2008. Chicago: SPSS Inc.
Rasband, W. S. ImageJ. U.S. National Institutes of Health, http://imagej.nih.gov/ij/ (1997–2012) Date of access:1/8/2012.
Wang, C. & Yu, C. Automated morphological classification of lung cancer subtypes using H&E tissue images. Mach. Vis. Appl. 24, 1383–1391 (2013).
Berger, C., Koeijer, J., Glas, W. & Madhuizen, H. Color Separation in Forensic Image Processing. J. Forensic Sciences 51, 100–102 (2006).
Ruifrok, A. C. & Johnston, D. A. Quantification of histochemical staining by color deconvolution. Anal. Quant. Cytol. Histol. 23, 291–299 (2001).
Wang, C. Fast automatic quantitative cell replication with fluorescent live cell imaging. BMC Bioinfo. 13, 1–10 (2012).
Acknowledgements
This work is jointly supported by the National Science Council of Taiwan under Grant No. NSC101-2628-E-011-006-MY3 and the Ministry of Education of Taiwan under the Excellent Young Scholar Research Grant to Prof Ching-Wei Wang.
Author information
Authors and Affiliations
Contributions
C.W. designed the study, built the method, implemented the software and wrote the paper; S.K. and A.C. contributed to the data collection of the histopathological data.
Ethics declarations
Competing interests
The authors declare no competing financial interests.
Rights and permissions
This work is licensed under a Creative Commons Attribution-NonCommercial-ShareAlike 4.0 International License. The images or other third party material in this article are included in the article's Creative Commons license, unless indicated otherwise in the credit line; if the material is not included under the Creative Commons license, users will need to obtain permission from the license holder in order to reproduce the material. To view a copy of this license, visit http://creativecommons.org/licenses/by-nc-sa/4.0/
About this article

Cite this article
Wang, CW., Ka, SM. & Chen, A. Robust image registration of biological microscopic images. Sci Rep 4, 6050 (2014). https://doi.org/10.1038/srep06050
Received:
Accepted:
Published:
DOI: https://doi.org/10.1038/srep06050
This article is cited by
-
Virtual alignment of pathology image series for multi-gigapixel whole slide images
Nature Communications (2023)
-
Fast cross-staining alignment of gigapixel whole slide images with application to prostate cancer and breast cancer analysis
Scientific Reports (2022)
-
A deep learning based framework for the registration of three dimensional multi-modal medical images of the head
Scientific Reports (2021)
-
Automatic Segmentation of Bone Canals in Histological Images
Journal of Digital Imaging (2021)
-
Fully Automatic Registration Methods for Chest X-Ray Images
Journal of Medical and Biological Engineering (2021)
Comments
By submitting a comment you agree to abide by our Terms and Community Guidelines. If you find something abusive or that does not comply with our terms or guidelines please flag it as inappropriate.
