
Abstract
The stratosphere, the layer of the atmosphere at heights between 10-50 km, is an important source of variability for the weather and climate at the Earth’s surface on timescales of weeks to decades. Since the stratospheric circulation evolves more slowly than that of the troposphere below, it can contribute to predictability at the surface. Our synthesis of studies on the coupling between the stratosphere and the troposphere reveals that the stratosphere also contributes substantially to a wide range of climate-related extreme events. These extreme events include cold air outbreaks and extreme heat, air pollution, wildfires, wind extremes, and storm clusters, as well as changes in tropical cyclones and sea ice cover, and they can have devastating consequences for human health, infrastructure, and ecosystems. A better understanding of the vertical coupling in the atmosphere, along with improved representation in numerical models, is therefore expected to help predict extreme events on timescales from weeks to decades in terms of the event type, magnitude, frequency, location, and timing. With a better understanding of stratosphere-troposphere coupling, it may be possible to link more tropospheric extremes to stratospheric forcing, which will be crucial for emergency planning and management.
Introduction
There is increasing demand for skillful prediction of weather impacts, especially for lead times beyond regular weather forecasts of 7–10 days1. Although a range of surface components of the coupled ocean-atmosphere system have been identified as sources of predictability on sub-seasonal to decadal timescales, i.e., for weeks to decades2, another potential source of predictability arises from the stratosphere3 at 10–50 km above the Earth’s surface. The stratosphere exhibits an overall slower evolution and longer predictability as compared to the troposphere4, and a downward influence from the stratosphere can thus contribute to persistent and predictable changes at the surface on timescales of weeks to years.
The stratospheric circulation consists of three large-scale features as follows: (i) the stratospheric meridional overturning circulation (i.e., the “Brewer–Dobson circulation”)5, which transports mass from the tropical to the extratropical stratosphere on timescales of months to years; (ii) the Quasi-biennial Oscillation (QBO)6, characterized by periodic (roughly 28 months) descending easterly and westerly equatorial jets driven by tropical Kelvin and Rossby-gravity waves; (iii) The stratospheric polar vortex7 (hereafter, polar vortex), a circumpolar westerly jet that forms in autumn, peaks in strength in winter, and decays again in spring. The polar vortex is strongly modulated by vertically propagating planetary-scale waves, sometimes leading to rapid changes. A particularly striking example of such a sudden change manifests as a “sudden stratospheric warming” (SSW)8, in which the polar vortex winds rapidly slow and the polar stratosphere warms. The vortex may also intensify and cool in “strong vortex events.” In turn, changes in the polar stratospheric circulation influence the propagation of waves, allowing the circulation anomalies to descend to the lower stratosphere and persist for months due to slow radiative recovery times at those levels. The extratropical stratosphere can also reflect upward propagating planetary-scale waves back downward9, with subsequent surface impacts.
The stratospheric circulation can exert influence on the surface climate in myriad ways. The Brewer–Dobson circulation exerts a direct influence on the temperature of the tropical tropopause and the amount of water vapor entering the stratosphere10, which in turn impacts surface climate though radiative changes. The QBO has local influences on the tropical tropopause layer and a remote influence on mid-latitude surface climate via modulations of extratropical wave propagation11. The downward influence of polar vortex anomalies on the lower stratosphere can modulate the circulation in the troposphere. In the Northern Hemisphere (NH), SSWs occur on average every other year and often lead to persistent blocking over Greenland associated with the negative phase of the North Atlantic Oscillation (NAO)12,13, altering surface weather for weeks to months14. A strengthening of the stratospheric polar vortex, on the other hand, tends to exert a downward influence in an opposite manner, towards the positive phase of the NAO15. In the Southern Hemisphere (SH), SSWs tend to be rare due to weaker planetary-scale wave forcing, but a weakening of the spring polar vortex tends to lead to a negative phase of the Southern Annular Mode (SAM) and an equatorward shift of the storm track (Fig. 2). A key point is that while the stratospheric circulation exhibits variability across timescales, it evolves more slowly than surface weather and can exert a persistent downward effect. Thus, the stratosphere can act as a driver of surface weather and a source of predictability for lead times longer than two weeks. This influence allows the stratosphere to also influence surface extreme events. This study provides an overview over the detected stratospheric influences on tropospheric extremes ranging from precipitation and temperature extremes to wildfires and sea ice loss. Further stratospheric influences on surface variability and extremes will likely emerge in future studies.
Tropospheric extremes driven by the stratosphere
Beyond the stratosphere’s influence on surface climate, it is less well recognized that the stratosphere can contribute to tropospheric extremes. Although it has long been known that SSW events contribute to extreme weather16, broader examples of extremes driven by a wide range of stratospheric phenomena have recently emerged in the literature. This section, summarized in Figs. 2 and 3, gives an overview of the surface extremes linked to stratospheric phenomena.
Extremes in the NH mid-latitudes and polar regions
NH stratospheric polar vortex extremes such as mid-winter SSWs or strong vortex events tend to precede a switch towards anomalously persistent weather conditions lasting up to 2 months. SSWs tend to be followed by cold air outbreaks in the mid-latitudes associated with extreme cold daily minimum and maximum temperatures (Figs. 1 and 2), particularly over Northern Europe and Asia17,18,19,20, which are linked to human health impacts21,22. Cold air outbreaks also occur over the North Atlantic and Arctic oceans, termed “marine cold air outbreaks” (MCAOs)23 (Fig. 2). MCAOs are linked to extreme surface wind speeds24 (Fig. 2), sometimes connected to an increased risk for the development of polar lows (also known as Arctic hurricanes)25,26, leading to increased exposure of offshore and coastal infrastructure and Arctic shipping. SSW-driven changes in temperatures and surface winds lead to increases in sea ice extent over the Bering Strait and Sea of Ohkotsk in winter and the Laptev, East Siberian, and Chukchi Seas in summer27,28 (Fig. 2), which can impact Arctic shipping and resource extraction operations, tourism, and local communities29. The equatorward shift of the North Atlantic storm track often leads to storms moving into Southern Europe along a persistent path and often in close succession30, increasing the risk of flooding in the Mediterranean (Fig. 2). Related to this, the 2016/17 drought on the Iberian peninsula abruptly ended after the 2018 SSW event31 (Fig. 3). Meanwhile, the north-western parts of Scandinavia and the British Isles tend to experience dry spells (Fig. 2), whereas anomalous warmth is observed over the eastern Canadian Arctic and subtropical Africa and Asia (Figs. 1 and 2).
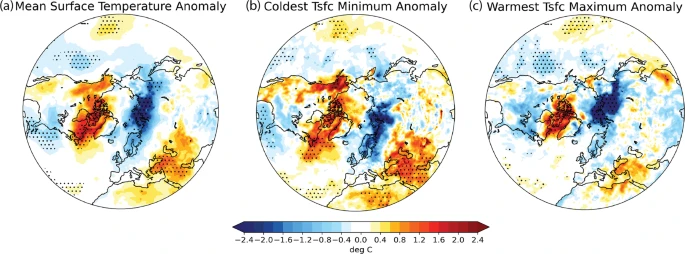
Difference between the composite of the 30 days following 24 observed SSWs and the composite of n randomly sampled 30-day periods from Dec-Apr, repeated 3000 times, for a daily mean surface temperature anomalies, b the coldest (within the 30-day period) daily minimum surface temperature anomaly, and c the warmest (within the 30-day period) daily maximum surface temperature anomaly. Surface temperature data and SSW dates are calculated using ERA-interim reanalysis (1979–2016)131. Stippling shows where the SSW composite anomalies are significantly different (p < 0.05, using a bootstrap with replacement test) from the randomly sampled composite anomalies.

a Two-meter temperature, b precipitation rate, and c surface wind anomalies (arrows indicate the direction and magnitude of the anomaly, shading indicates the magnitude of the anomaly) after weak vortex events for both hemispheres. The values are averaged over the 45-day period following a case of an extreme weak vortex event in each hemisphere, i.e., the period from 13 February 2018 to 29 March 2018 in the Northern Hemisphere and 26 September 2002 to 9 November 2002 using data from the NCEP/NCAR reanalysis132.

The area of influence for each stratospheric precursor is indicated in the map with matching colors. The map gives examples for extreme events that have been linked to stratospheric origins, as detailed in the text.
Strong polar vortex events, on the other hand, are followed by the opposite, i.e., positive phase of the NAO, associated with an increased risk of drought in southern Europe32, since the storm track is stronger and more zonally oriented towards Northern Europe. A record-strong NH polar vortex in early 2020 was associated with a series of successive storms that hit the UK and Northern Europe, and caused extensive damage33 (Fig. 3) and unprecedented warmth over Eurasia34. Wave reflection events can contribute to cold air outbreaks over central Canada and North America35,36, such as, e.g., in December 201737 (Fig. 3).
Although the above extremes are limited to boreal winter, further impacts are associated with extremes in boreal spring when the polar vortex gives way to summer easterlies in the stratosphere. This transition is associated with an NAO-like shift in surface climate38 and may influence Arctic sea ice conditions into autumn39. The timing of the final vortex breakdown can have significant implications for stratospheric ozone chemistry, as a vortex that stays strong well into spring as sunlight returns to the pole provides ideal conditions for rapid ozone loss, as observed in spring 202034. Stratospheric ozone minima in spring have been suggested to be followed by anomalous cold over subtropical Asia and southern Europe, and anomalous warmth over northern Asia40,41.
On timescales of years to decades, the NH polar stratosphere may also influence surface variability. For example, decadal variations in the NH polar vortex have been linked to a “hiatus” in Eurasian warming42. It remains unclear whether this variability in NH polar vortex strength is anthropogenically forced (e.g., via declining Arctic sea ice and amplified Arctic warming due to increased greenhouse gases43,44), or if it represents internal variations of the coupled atmosphere-ocean system45. Regardless, the implications are that decadal changes in NH polar stratospheric variability may contribute to decadal variability in the extratropics, against the background of a warming climate. Furthermore, the meridional overturning circulation in the North Atlantic ocean has been suggested to be influenced by stratospheric variability46.
Other extremes tied to NH polar vortex variability remain to be explored. While the NAO has been linked to a wide range of surface extremes, especially over Europe17, linking these extremes to polar vortex variability has been explored less, and could provide opportunities for enhanced prediction. For example, the negative phase of the NAO is associated with persistent and extreme warm anomalies over Northern Africa and the Middle East47 (Fig. 1), and increased Mediterranean rainfall that inhibits Saharan dust transport48. Temperature extremes following polar vortex events may contribute to ice loss over Greenland49 (Figs. 2, and 3), as well as heatwaves and thawing of permafrost in Siberia, such as, e.g., in spring 202050 (Fig. 3). In addition, a more detailed analysis of impacts beyond surface temperature and precipitation would be useful information for transportation, energy, and agriculture, such as the type and intensity of precipitation, or other types of severe weather such as hail, lightning, or surface wind gusts, which have a direct impact on infrastructure, property, and life. Links of SSWs to ionospheric irregularities, which can impact global communications and navigation, have also been suggested51 and could be further investigated. Connections to atmospheric chemistry and air quality would be valuable. For example, modulations of the Brewer–Dobson circulation influence stratospheric ozone52 and are related to irreversible ozone transport to the troposphere53, where it can worsen air quality54. Meteorological conditions following SSWs could also set up conditions for stagnation of haze and pollution; e.g., the East China Plains saw a record-breaking haze pollution event following the January 2013 SSW55.
Extremes in the SH mid-latitudes and polar regions
Although wintertime stratospheric variability is smaller in the SH compared to the NH, the timing of the transition of the polar stratosphere from its winter to summer state has significant implications for surface climate and extremes56,57. A weakening of the SH stratospheric polar vortex leads to an equatorward shift of the storm track and a negative phase of the SAM, contributing to extended hot and dry spells over Australia58, and a weakening of the wind stress at the ocean surface around Antarctica (Fig. 2). Vortex deceleration has also been associated with anomalous cold over southeast Africa and New Zealand, colder and wetter weather over southern South America59, anomalous warmth over the Ross and Amundsen Seas, and dry and cold spells over Antarctica56 (Fig. 2). Record low Antarctic sea ice in December 2016 has been linked to an early polar vortex weakening60 (Fig. 3).
SSWs in the SH—although rare—can similarly have a downward influence that projects onto the negative phase of the SAM, as seen following the only known major SH SSW in 2002, which was associated with anomalous heat over Antarctica61 (Figs. 2 and 3). It is likely that the devastating 2019 Australian wildfires were related to the minor SSW in austral winter 201962 (Fig. 3), which in turn affected the stratosphere63. SSWs in the SH lead to substantial increases in polar stratospheric ozone, temporarily mitigating anthropogenic ozone depletion, as observed during the SSW events in 2002 and 2019. On the other hand, a strong stratospheric vortex in spring as sunlight returns can lead to a sudden cascade of chemical ozone loss64. Depending on the vortex location this can lead to a significant increase in incoming harmful UV radiation over populated regions, with implications for health, food and water security, and ecosystems65. Interannual variations in the ozone hole are also linked to the variability of the SAM and its associated impacts on summertime surface climate and extremes66.
On decadal and longer timescales, the depletion of the stratospheric ozone layer by man-made chlorofluorocarbons led to a strengthening of the austral spring polar vortex and a poleward shift of the SH storm tracks in austral summer over the period 1960–199967. This trend was associated with a broad range of climate impacts, including increased subtropical precipitation68, summertime warming of the Antarctic peninsula and cooling over east Antarctica69, decreases in low-level clouds across the Southern Ocean and increases in mid- to high-level clouds over Antarctica and the subtropics70, shifts in the fronts associated with in the Antarctic Circumpolar Current71, reduced carbon uptake72, and enhanced Southern Ocean acidification73. With the recovery of the ozone layer underway due to the Montreal Protocol74, the associated trends in circulation and climate patterns have started to slow or reverse75, though they are also affected by climate change.
Tropical and subtropical extremes
Less research has been performed on how tropical and subtropical stratospheric variability influences tropospheric extremes in part because of relatively few QBO cycles during the satellite record, and the inability of most climate models until recently to intrinsically reproduce the QBO, although significant progress has recently been made in QBO representation in models76,77. As the QBO is associated with a meridional circulation that induces temperature changes in the tropical tropopause layer, it can influence tropical deep convection via changes to static stability and vertical wind shear, and high-cloud properties near the tropopause78,79. In particular, the easterly phase of the QBO is associated with enhanced deep convection over the western tropical Pacific and decreased deep convection over the central and eastern tropical Pacific regions78, and with reduced intensity of the Indian monsoon in August–September80,81, with potential impacts on rainfall extremes82. The QBO has also been linked to modulations of the tropical Hadley cell, such that easterly QBO winds are associated with decreased precipitation over Australia83.
Moreover, the QBO is strongly related to modulations in the Madden–Julian Oscillation (MJO)84,85: the easterly QBO is linked to a more active and persistent MJO in boreal winter, although the mechanism remains uncertain. The QBO can alter the teleconnections of the MJO86,87,88, and thus by extension, its extreme impacts. For example, when the QBO winds are easterly, there is stronger and more organized precipitation over east Asia during certain MJO phases89 and stronger MJO-related modulations of the amplitude and structure of the North Pacific storm track90. Further investigation into if and how the QBO may modify other MJO-related extremes, e.g., ref. 91, would be valuable. The QBO may also impact climate extremes related to polar vortex variability via its own teleconnection to the extratropics11,92.
Variability in the Brewer–Dobson circulation driven by tropospheric waves can affect tropical upwelling, with implications for tropical convective patterns and precipitation93. For example, accelerations of the Brewer–Dobson circulation associated with SSWs lead to enhanced tropical upwelling94,95, which may reduce the static stability in the tropical tropopause layer and enhance SH tropical convection96,97 (Fig. 2).
On interannual and longer timescales, lowermost stratospheric temperatures may influence tropical cyclone activity. In recent decades, cooling of the tropical tropopause layer associated with stratospheric ozone depletion and circulation changes may have decreased tropical cyclone outflow temperatures and enhanced tropical cyclone potential intensity in the North Atlantic98,99.
Pathways towards prediction and projection of extremes driven by the stratosphere
Given the stratosphere’s effect on global surface extremes, its downward influence could carry more weight than anticipated for the prediction of surface extremes and their devastating impacts. On sub-seasonal to seasonal timescales, the stratosphere is already known as a predictor of tropospheric anomalies and extremes both in mid-winter100,101,102,103 and spring104. In particular, stratospheric events have been used with some success to predict cold air outbreaks e.g.105,106,107,108 and winter storm frequency109. Anomalous surface wind speeds, surface temperatures, and precipitation following stratospheric polar vortex anomalies may be used for sub-seasonal to seasonal predictions of energy supply110,111 and demand112, as well as transportation113. The state of the QBO has been used to improve prediction of atmospheric rivers, which are linked to extreme rainfall events in western North America114, such as the event in December 1979115 (Fig. 3). With a better understanding of the vertical coupling, it is likely that more extremes and their impacts will emerge as being driven or modulated by stratospheric forcing, and recognizing the stratosphere as a driver of extremes will benefit prediction on all timescales from weeks to centuries.
Nonetheless, the full potential of stratospheric information for improving the prediction of surface extremes has not yet been realized, especially given the limited representation of stratosphere–troposphere coupling and persistent model bias in many prediction systems and climate models116. Efforts are ongoing in the stratosphere community to address these problems. Although some stratospheric biases have been greatly mitigated in recent years by raising the model lid and improving vertical resolution117, others have not been resolved. For example, many climate models either cannot intrinsically simulate a QBO or simulate a degraded version76, and forecast models initialized with QBO winds lose information about the amplitude and even sign of tropical winds within 1–2 weeks118. The full spectrum and amplitude of wave coupling linking the troposphere and the stratosphere is also not well represented or poorly parameterized119,120. Other stratospheric processes that are not yet well captured by many numerical models, such as interactive ozone chemistry or radiative effects of aerosols, may influence extremes in ways that remain to be determined. For example, increases in extreme wildfires and pyrocumulus clouds could inject aerosols into the stratosphere, where they can persist for months to even years, affecting radiative balance, convection, and circulation121,122. Ongoing efforts to quantify and resolve model biases and to incorporate missing processes are expected to improve the prediction of extremes tied to stratospheric processes.
In light of climate change, it is not resolved to what extent the relationship between the stratosphere and the troposphere will evolve, as both the troposphere and the stratosphere are undergoing significant changes. In particular, greenhouse gas increases are associated with cooling of the stratosphere and warming of the troposphere. The enhanced warming in the tropical upper troposphere is expected to lead to increases in the upper troposphere-lower stratosphere equator-to-pole temperature gradient, which should strengthen the polar vortex and shift the storm tracks poleward in both hemispheres. However, in the NH, the amplified surface warming in the Arctic reduces the surface equator-to-pole temperature gradient at the surface and shifts the storm tracks equatorward, leading to a “tug of war” between the upper and lower tropospheric temperature gradient changes123,124,125. These counteracting influences contribute to highly uncertain trends in the stratospheric polar vortex, with no consensus among climate models on whether the vortex will strengthen or weaken126. The uncertain future of the NH polar stratosphere is linked to uncertainties in the projection of the tropospheric jet streams and associated climate extremes127,128. In the SH, stratospheric ozone recovery counteracts the predicted poleward shift of the jet stream due to climate change75,129, with potential effects on regional precipitation extremes and surface wind stress. Finally, in the tropics, it is unclear how the QBO will be affected by climate change, with most models indicating a decreased amplitude, but either enhanced or reduced periodicity76, whereas extratropical teleconnections of the QBO appear to strengthen130. Thus, better understanding of stratosphere–troposphere processes may be imperative for reducing uncertainties in projected likelihoods of future climate extremes.
Outlook towards future research
The downward influence from the stratosphere has been found to trigger or modulate the strength of a range of extreme events. These links can contribute to the understanding and prediction of surface extremes and their impacts on human health, infrastructure, energy, and ecosystems. In particular, extreme events in mid-latitudes and polar regions such as flooding, drought, and cold air outbreaks have been linked to stratospheric forcing. In the tropics, tropical convection and hurricanes can be modulated by the stratosphere. Attribution is however challenging given the often poorly represented stratospheric variability and coupling processes with the troposphere. Further research will benefit from incorporating and modeling additional processes such as aerosols and chemistry, in addition to improved understanding and model representation of the dynamical coupling. Extreme events may then more readily be linked to stratospheric forcing, with benefits for the prediction of extreme events and their impacts at lead times beyond 2 weeks. An improved prediction of the stratosphere itself on sub-seasonal to decadal lead times may also contribute to increased lead times for surface extremes. Large regions in Africa, Asia, and South America, as well as major ocean regions are affected by stratospheric forcing, e.g., through hot or cold and wet or dry spells, but not yet sufficiently studied with respect to extreme events in relation to the stratosphere. Furthermore, the uncertain dynamical response of the stratosphere to a changing climate contributes significantly to uncertainties in projections of future surface extremes.
References
White, C. J. et al. Potential applications of subseasonal-to-seasonal (S2S) predictions. Meteorol. Appl. 24, 315–325 (2017).
Merryfield, W. J. et al. Current and emerging developments in subseasonal to decadal prediction. Bull. Am. Meteorol. Soc. 101, E869–E896 (2020).
Butler, A. et al. In Sub-Seasonal to Seasonal Prediction 223–241 (Elsevier, 2019).
Domeisen, D. I. V. et al. The role of the stratosphere in subseasonal to seasonal prediction. 1. Predictability of the stratosphere. J. Geophys. Res. Atmos. 125, e2019JD030920 (2020).
Butchart, N. The Brewer-Dobson circulation. Rev. Geophys. 52, 157–184 (2014).
Baldwin, M. P. et al. The quasi-biennial oscillation. Rev. Geophys. 39, 179–229 (2001).
Waugh, D. W., Sobel, A. H. & Polvani, L. M. What is the polar vortex and how does it influence weather? Bull. Am. Meteorol. Soc. 98, 37–44 (2017).
Baldwin, M. P. et al. Sudden stratospheric warmings. Rev. Geophys. in press (2020).
Shaw, T. A. & Perlwitz, J. The life cycle of Northern Hemisphere downward wave coupling between the stratosphere and troposphere. J. Clim. 26, 1745–1763 (2013).
Fueglistaler, S. et al. Tropical tropopause layer. Rev. Geophys. 47, RG1004 (2009).
Gray, L. J. et al. Surface impacts of the Quasi Biennial Oscillation. Atmos. Chem. Phys. 18, 8227–8247 (2018).
Charlton-Perez, A. J., Ferranti, L. & Lee, R. W. The influence of the stratospheric state on North Atlantic weather regimes. Q. J. R. Meteorol. Soc. 144, 1140–1151 (2018).
Domeisen, D. I. V. Estimating the frequency of sudden stratospheric warming events from surface observations of the North Atlantic Oscillation. J. Geophys. Res. Atmos. 124, 3180–3194 (2019).
Kidston, J. et al. Stratospheric influence on tropospheric jet streams, storm tracks and surface weather. Nat. Geosci. 8, 433–440 (2015).
Limpasuvan, V., Hartmann, D. L., Thompson, D., Jeev, K. & Yung, Y. L. Stratosphere-troposphere evolution during polar vortex intensification. J. Geophys. Res. Atmos. 110, https://doi.org/10.1029/2005JD006302 (2005).
Hartmann, D. Droughts, severe winters and sudden stratospheric warmings. Nature 293, 97–98 (1981).
Scaife, A. A., Folland, C. K., Alexander, L. V., Moberg, A. & Knight, J. R. European climate extremes and the North Atlantic Oscillation. J. Clim. 21, 72–83 (2008).
Kolstad, E. W., Breiteig, T. & Scaife, A. A. The association between stratospheric weak polar vortex events and cold air outbreaks in the Northern Hemisphere. Q. J. R. Meteorol. Soc. 136, 886–893 (2010).
Butler, A. H., Sjoberg, J. P., Seidel, D. J. & Rosenlof, K. H. A sudden stratospheric warming compendium. Earth Syst. Sci. Data 9, 63–76 (2017).
King, A. D., Butler, A. H., Jucker, M., Earl, N. O. & Rudeva, I. Observed Relationships Between Sudden Stratospheric Warmings and European Climate Extremes. J. Geophys. Res. Atmos. 124, 13943–13961 (2019). Disruptions of the polar vortex have an effect not just on the mean climate over Europe but also on surface extremes.
Charlton-Perez, A. J., Aldridge, R. W., Grams, C. M. & Lee, R. Winter pressures on the UK health system dominated by the Greenland Blocking weather regime. Weather Clim. Extremes 25, 100218 (2019).
Charlton-Perez, A., Huang, W. T. K. & Lee, S. H. Impact of sudden stratospheric warmings on united kingdom mortality. R. Meteorol. Soc. https://doi.org/10.1002/asl.1013 (2020).
Afargan-Gerstman, H. et al. Stratospheric influence on marine cold air outbreaks in the Barents Sea. Weather Clim. Dyn. https://doi.org/10.5194/wcd-1-541-2020 (2020).
Kolstad, E. W. Higher ocean wind speeds during marine cold air outbreaks. Q. J. R. Meteorol. Soc. 143, 2084–2092 (2017).
Rasmussen, E. A., Turner, J. & Thorpe, A. Polar lows: mesoscale weather systems in the polar regions. Q. J. R. Meteorol. Soc. 130, 371–372 (2004).
Radovan, A., Crewell, S., Moster Knudsen, E. & Rinke, A. Environmental conditions for polar low formation and development over the Nordic Seas: study of January cases based on the Arctic System Reanalysis. Tellus A Dyn. Meteorol. Oceanogr. 71, 1–16 (2019).
Williams, J., Tremblay, B., Newton, R. & Allard, R. Dynamic preconditioning of the minimum September sea-ice extent. J. Clim. 29, 5879–5891 (2016).
Smith, K. L., Polvani, L. M. & Tremblay, L. B. The impact of stratospheric circulation extremes on minimum Arctic Sea ice extent. J. Clim. 31, 7169–7183 (2018).
Stroeve, J. et al. Improving predictions of Arctic Sea ice extent. Earth Space Sci. 96, 11 (2015).
Afargan-Gerstman, H. & Domeisen, D. I. V. Pacific modulation of the North Atlantic storm track response to sudden stratospheric warming events. Geophys. Res. Lett. 47, https://doi.org/10.1029/2019GL085007 (2020).
Ayarzagüena, B. et al. Stratospheric connection to the abrupt end of the 2016/2017 Iberian drought. Geophys. Res. Lett. 45, 12,639–12,646 (2018).
López-Moreno, J. I. & Vicente-Serrano, S. M. Positive and negative phases of the wintertime North Atlantic oscillation and drought occurrence over Europe: a multitemporal-scale approach. J. Clim. 21, 1220–1243 (2008).
McCarthy, M. Met Office: why the UK saw record-breaking rainfall in February 2020. Carbon Brief, https://www.carbonbrief.org/met-office-why-the-uk-saw-record-breaking-rainfall-in-february-2020 (2020).
Lawrence, Z. D. et al. The remarkably strong Arctic stratospheric polar vortex of winter 2020: links to record-breaking Arctic oscillation and ozone loss. J. Geophys. Res. Atmos. 1–29. https://doi.org/10.1029/2020JD033271 (2020).
Kretschmer, M., Cohen, J., Matthias, V., Runge, J. & Coumou, D. The different stratospheric influence on cold-extremes in Eurasia and North America. npj Clim. Atmos. Sci. 1, 44 (2018). Different structures of the stratospheric polar vortex can have unique impacts on surface extremes over Eurasia and North America.
Lee, S. H., Furtado, J. C. & Perez, A. J. C. Wintertime North American weather regimes and the Arctic stratospheric polar vortex. Geophys. Res. Lett. 46, 14892–14900 (2019).
Matthias, V. & Kretschmer, M. The influence of stratospheric wave reflection on North American cold spells. Monthly Weather Rev. 148, 1675–1690 (2020).
Black, R., McDaniel, B. & Robinson, W. A. Stratosphere-troposphere coupling during spring onset. J. Clim. 19, 4891–4901 (2006).
Kelleher, M. E., Ayarzaguena, B. & Screen, J. A. Interseasonal connections between the timing of the stratospheric final warming and Arctic Sea Ice. J. Clim. 33, 3079–3092 (2020).
Calvo, N., Polvani, L. M. & Solomon, S. On the surface impact of Arctic stratospheric ozone extremes. Environ. Res. Lett. 10, 10.1088/1748-9326/10/9/094003 (2015).
Ivy, D. J., Solomon, S., Calvo, N. & Thompson, D. W. J. Observed connections of Arctic stratospheric ozone extremes to Northern Hemisphere surface climate. Environ. Res. Lett. 12, 024004 (2017).
Garfinkel, C. I., Son, S.-W., Song, K., Aquila, V. & Oman, L. D. Stratospheric variability contributed to and sustained the recent hiatus in Eurasian winter warming. Geophys. Res. Lett. 44, 374–382 (2017).
Cohen, J. et al. Recent Arctic amplification and extreme mid-latitude weather. Nat. Geosci. 7, 627–637 (2014).
Kretschmer, M., Zappa, G. & Shepherd, T. G. The role of Arctic sea ice loss in projected polar vortex changes. Weather Clim. Dyn. Discuss. https://doi.org/10.5194/wcd-2020-29 (2020).
Blackport, R. & Screen, J. A. Insignificant effect of Arctic amplification on the amplitude of midlatitude atmospheric waves. Sci. Adv. 6, eaay2880 (2020).
Reichler, T., Kim, J., Manzini, E. & Kröger, J. A stratospheric connection to Atlantic climate variability. Nat. Geosci. 5, 783–787 (2012).
Donat, M. G. et al. Changes in extreme temperature and precipitation in the Arab region: long-term trends and variability related to ENSO and NAO. Int. J. Climatol. 34, 581–592 (2014).
Moulin, C., Lambert, C. E., Dulac, F. & Dayan, U. Control of atmospheric export of dust from North Africa by the North Atlantic Oscillation. Nature 387, 691–694 (1997).
Moore, G. W. K., Schweiger, A., Zhang, J. & Steele, M. What caused the remarkable February 2018 North Greenland polynya? Geophys. Res. Lett. 45, 13,342–13,350 (2018).
Overland, J. E. & Wang, M. The 2020 Siberian heat wave. Int. J. Climatol. 1–6, https://doi.org/10.1002/joc.68506 (2020).
De Paula, E. R. et al. Low-latitude scintillation weakening during sudden stratospheric warming events. J. Geophys. Res. Space Phys. 120, 2212–2221 (2015).
de la Cámara, A., Abalos, M., Hitchcock, P., Calvo, N. & Garcia, R. R. Response of Arctic ozone to sudden stratospheric warmings. Atmos. Chem. Phys. 18, 16499–16513 (2018).
Albers, J. R. et al. Mechanisms governing interannual variability of stratosphere-to-troposphere ozone transport. J. Geophys. Res. Atmos. 123, 234–260 (2018).
Langford, A. O. et al. Stratospheric influence on surface ozone in the Los Angeles area during late spring and early summer of 2010. J. Geophys. Res. Atmos. 117, https://doi.org/10.1029/2011JD016766 (2012).
Zou, Y., Wang, Y., Zhang, Y. & Koo, J.-H. Arctic sea ice, Eurasia snow, and extreme winter haze in China. Sci. Adv. 3, e1602751 (2017).
Lim, E. P., Hendon, H. H. & Thompson, D. W. J. Seasonal evolution of stratosphere-troposphere coupling in the Southern Hemisphere and implications for the predictability of surface climate. J. Geophys. Res. Atmos. 123, 12,002–12,016 (2018).
Byrne, N. J. & Shepherd, T. G. Seasonal persistence of circulation anomalies in the Southern Hemisphere stratosphere and its implications for the troposphere. J. Clim. 31, 3467–3483 (2018).
Lim, E.-P. et al. Australian hot and dry extremes induced by weakenings of the stratospheric polar vortex. Nat. Geosci. 12, 896–901 (2019). The strength of the Southern Hemisphere polar vortex is linked to weather extremes in Australia.
Garreaud, R., Lopez, P., Minvielle, M. & Rojas, M. Large-scale control on the Patagonian climate. J. Clim. 26, 215–230 (2013).
Wang, G. et al. Compounding tropical and stratospheric forcing of the record low Antarctic sea-ice in 2016. Nat. Commun. 10, 1–9 (2019).
Thompson, D. W. J., Baldwin, M. P. & Solomon, S. Stratosphere–troposphere coupling in the Southern Hemisphere. J. Atmos. Sci. 62, 708–715 (2005).
Hendon, H. et al. Rare forecasted climate event under way in the Southern Hemisphere. Nat. Correspond. 573, 495 (2019).
Khaykin, S. et al. The 2019/20 Australian wildfires generated a persistent smoke-charged vortex rising up to 35 km altitude. Commun. Earth Environ. 1, 1–12 (2020).
Schoeberl, M. R. & Hartmann, D. L. The dynamics of the stratospheric polar vortex and its relation to springtime ozone depletions. Science 251, 46–52 (1991).
Barnes, P. W. et al. Ozone depletion, ultraviolet radiation, climate change and prospects for a sustainable future. Nat. Sustainability 2, 569–579 (2019).
Bandoro, J., Solomon, S., Donohoe, A., Thompson, D. W. J. & Santer, B. D. Influences of the Antarctic ozone hole on Southern Hemispheric summer climate change. J. Clim. 27, 6245–6264 (2014).
Son, S., Tandon, N. & Polvani, L. Ozone hole and Southern Hemisphere climate change. Geophys. Res. Lett. 36, https://doi.org/10.1029/2009GL038671 (2009).
Kang, S. M., Polvani, L. M., Fyfe, J. C. & Sigmond, M. Impact of polar ozone depletion on subtropical precipitation. Science 332, 951–954 (2011).
Thompson, D. W. J. et al. Signatures of the Antarctic ozone hole in Southern Hemisphere surface climate change. Nat. Geosci. 4, 741–749 (2011).
Grise, K. M., Polvani, L. M., Tselioudis, G., Wu, Y. & Zelinka, M. D. The ozone hole indirect effect: Cloud-radiative anomalies accompanying the poleward shift of the eddy-driven jet in the Southern Hemisphere. Geophys. Res. Lett. 40, 3688–3692 (2013).
Sigmond, M., Reader, M. C., Fyfe, J. C. & Gillett, N. P. Drivers of past and future Southern Ocean change: stratospheric ozone versus greenhouse gas impacts. Geophys. Res. Lett. 38, 10.1029/2011GL047120 (2011).
Lenton, A. et al. Stratospheric ozone depletion reduces ocean carbon uptake and enhances ocean acidification. Geophys. Res. Lett. 36, https://doi.org/10.1029/2009GL038227 (2009).
Xue, L. et al. Climatic modulation of surface acidification rates through summertime wind forcing in the Southern Ocean. Nat. Commun. 9, 11 (2018).
Solomon, S. et al. Emergence of healing in the Antarctic ozone layer. Science 353, 269–274 (2016).
Banerjee, A., Fyfe, J. C., Polvani, L. M., Waugh, D. & Chang, K.-L. A pause in Southern Hemisphere circulation trends due to the Montreal Protocol. Nature 579, 544–548 (2020). Southern Hemisphere circulation trends associated with ozone depletion have started to slow or reverse as the ozone layer begins to recover.
Richter, J. H. et al. Progress in simulating the quasi-biennial oscillation in CMIP models. J. Geophys. Res. Atmos. 125, 1 (2020). More coupled atmosphere-ocean climate models are able to internally generate the Quasi-biennial Oscillation, but biases in the vertical extent and amplitude persist.
Orbe, C. et al. Representation of modes of variability in six U.S. climate models. J. Clim. 33, 7591–7617 (2020).
Collimore, C. C., Martin, D. W., Hitchman, M. H., Huesmann, A. & Waliser, D. E. On the relationship between the QBO and tropical deep convection. J. Clim. 16, 2552–2568 (2003).
Nie, J. & Sobel, A. H. Responses of tropical deep convection to the QBO: cloud-resolving simulations. J. Atmos. Sci. 72, 3625–3638 (2015).
Giorgetta, M. A., Bengtsson, L. & Arpe, K. An investigation of QBO signals in the east Asian and Indian monsoon in GCM experiments. Clim. Dyn. 15, 435–450 (1999).
Claud, C. & Terray, P. Revisiting the possible links between the quasi-biennial oscillation and the Indian summer monsoon using NCEP R-2 and CMAP fields. J. Clim. 20, 773–787 (2007).
Singh, D., Ghosh, S., Roxy, M. K. & McDermid, S. Indian summer monsoon: extreme events, historical changes, and role of anthropogenic forcings. Wiley Interdiscip. Rev. Clim. Change 10, 12653 (2019).
Liess, S. & Geller, M. A. On the relationship between QBO and distribution of tropical deep convection. J. Geophys. Res. Atmos. 117, 10.1029/2011JD016317 (2012).
Yoo, C. & Son, S.-W. Modulation of the boreal wintertime Madden-Julian oscillation by the stratospheric quasi-biennial oscillation. Geophys. Res. Lett. 43, 1392–1398 (2016).
Klotzbach, P. et al. On the emerging relationship between the stratospheric Quasi-Biennial oscillation and the Madden-Julian oscillation. Sci. Rep. 9, 9 (2019).
Son, S.-W., Lim, Y., Yoo, C., Hendon, H. H. & Kim, J. Stratospheric control of the Madden–Julian oscillation. J. Clim. 30, 1909–1922 (2017). Tropical convection associated with the Madden-Julian Oscillation is stronger and more organized when the tropical stratospheric winds are easterly.
Toms, B. A., Barnes, E. A., Maloney, E. D. & van den Heever, S. C. The global teleconnection signature of the Madden-Julian oscillation and its modulation by the quasi-biennial oscillation. J. Geophys. Res. Atmos. 125, e2020JD032653 (2020).
Hood, L. L., Redman, M. A., Johnson, W. L. & Galarneau Jr., T. J. Stratospheric influences on the MJO-induced Rossby wave train: effects on intraseasonal climate. J. Clim. 33, 365–389 (2019).
Kim, H., Son, S.-W. & Yoo, C. QBO modulation of the MJO-rprecipitation in East Asia. J. Geophys. Res. Atmos. 125, e2019JD031929 (2020).
Wang, J., Kim, H.-M., Chang, E. K. M. & Son, S.-W. Modulation of the MJO and North Pacific storm track relationship by the QBO. J. Geophys. Res. Atmos. 123, 3976–3992 (2018).
Peng, J. et al. The impact of the Madden-Julian oscillation on hydrological extremes. J. Hydrol. 571, 142–149 (2019).
Holton, J. R. & Tan, H. C. The influence of the equatorial quasi-biennial oscillation on the global circulation at 50 mb. J. Atmos. Sci. 37, 2200–2208 (1980).
Wang, F., Han, Y., Zhang, S. & Zhang, R. Influence of stratospheric sudden warming on the tropical intraseasonal convection. Environ. Res. Lett. 15, 084027 (2020).
de la Camara, A., Abalos, M. & Hitchcock, P. Changes in stratospheric transport and mixing during sudden stratospheric warmings. J. Geophys. Res. Atmos. 123, 3356–3373 (2018).
Noguchi, S., Kuroda, Y., Kodera, K. & Watanabe, S. Robust enhancement of tropical convective activity by the 2019 Antarctic sudden stratospheric warming. Geophys. Res. Lett. 47, 489–9 (2020).
Kodera, K. Influence of stratospheric sudden warming on the equatorial troposphere. Geophys. Res. Lett. 33, https://doi.org/10.1029/2005GL024510 (2006).
Eguchi, N., Kodera, K. & Nasuno, T. A global non-hydrostatic model study of a downward coupling through the tropical tropopause layer during a stratospheric sudden warming. Atmos. Chem. Phys. 15, 297–304 (2015).
Emanuel, K., Solomon, S., Folini, D., Davis, S. & Cagnazzo, C. Influence of tropical tropopause layer cooling on Atlantic hurricane activity. J. Clim. 26, 2288–2301 (2013).
Wang, S., Camargo, S. J., Sobel, A. H. & Polvani, L. M. Impact of the tropopause temperature on the intensity of tropical cyclones: an idealized study using a mesoscale model. J. Atmos. Sci. 71, 4333–4348 (2014).
Sigmond, M., Scinocca, J. F., Kharin, V. V. & Shepherd, T. G. Enhanced seasonal forecast skill following stratospheric sudden warmings. Nat. Geosci. 6, 1–5 (2013).
Tripathi, O. P., Charlton-Perez, A., Sigmond, M. & Vitart, F. Enhanced long-range forecast skill in boreal winter following stratospheric strong vortex conditions. Environ. Res. Lett. 10, 1–8 (2015).
Scaife, A. A. et al. Seasonal winter forecasts and the stratosphere. Atmos. Sci. Lett. 17, 51–56 (2016).
Domeisen, D. I. V. et al. The role of the stratosphere in subseasonal to seasonal prediction: 2. Predictability arising from stratosphere - troposphere coupling. J. Geophys. Res. Atmos. 125, e2019JD030923 (2020). Variability in the stratosphere impacts surface predictive skill on sub-seasonal timescales.
Butler, A. H., Perez, A. C., Domeisen, D. I. V., Simpson, I. R. & Sjoberg, J. Predictability of Northern Hemisphere final stratospheric warmings and their surface impacts. Geophys. Res. Lett. 43, 23 (2019).
Scaife, A. A. & Knight, J. R. Ensemble simulations of the cold European winter of 2005-2006. Q. J. R. Meteorol. Soc. 134, 1647–1659 (2008).
Cai, M. et al. Feeling the pulse of the stratosphere: an emerging opportunity for predicting continental-scale cold-air outbreaks 1 month in advance. BAMS 97, 1475–1489 (2016).
Kautz, L. A., Polichtchouk, I., Birner, T., Garny, H. & Pinto, J. G. Enhanced extended-range Predictability of the 2018 late-winter Eurasian Cold Spell due to the Stratosphere. Q. J. R. Meteorol. Soc. 146, 1040–1055 (2020).
Yu, Y., Cai, M., Shi, C. & Ren, R. On the linkage among strong stratospheric mass circulation, stratospheric sudden warming, and cold weather events. Monthly Weather Rev. 146, 2717–2739 (2018).
Hansen, F., Kruschke, T., Greatbatch, R. J. & Weisheimer, A. Factors influencing the seasonal predictability of Northern Hemisphere severe winter storms. Geophys. Res. Lett. 46, 365–373 (2019).
Beerli, R., Wernli, H. & Grams, C. M. Does the lower stratosphere provide predictability for month-ahead wind electricity generation in Europe? Q. J. R. Meteorol. Soc. 143, 3025–3036 (2017). Winds in the lower stratosphere can be used for skillful forecasts of European wind electricity generation up to one month ahead of time.
Büeler, D., Beerli, R., Wernli, H. & Grams, C. M. Stratospheric influence on ECMWF sub-seasonal forecast skill for energy-industry-relevant surface weather in European countries. Q. J. R. Meteorol. Soc. https://doi.org/10.1002/qj.3866 (2020).
Thornton, H. E. et al. Skilful seasonal prediction of winter gas demand. Environ. Res. Lett. 14, 2 (2019).
Palin, E. J. et al. Skillful seasonal forecasts of winter disruption to the UK. Transport System. J. Appl. Meteorol. Climatol. 55, 325–344 (2016).
Mundhenk, B. D., Barnes, E. A., Maloney, E. D. & Baggett, C. F. Skillful empirical subseasonal prediction of landfalling atmospheric river activity using the Madden–Julian oscillation and quasi-biennial oscillation. npj Clim. Atmos. Sci. 1, 20177 (2018).
Baggett, C. F., Barnes, E. A., Maloney, E. D. & Mundhenk, B. D. Advancing atmospheric river forecasts into subseasonal-to-seasonal time scales. Geophys. Res. Lett. 44, 7528–7536 (2017).
Kolstad, E. W., Wulff, C. O., Domeisen, D. I. V. & Woollings, T. Tracing North Atlantic Oscillation forecast errors to stratospheric origins. J. Clim. 33, 9145–9157 (2020).
Charlton-Perez, A. J. et al. On the lack of stratospheric dynamical variability in low-top versions of the CMIP5 models. J. Geophys. Res. Atmos. 118, 2494–2505 (2013).
Butler, A. H. et al. The Climate-System Historical Forecast Project: do stratosphere-resolving models make better seasonal climate predictions in boreal winter? Q. J. R. Meteorol. Soc. 142, 1413–1427 (2016).
Eichinger, R. et al. Effects of missing gravity waves on stratospheric dynamics; part 1: climatology. Clim. Dyn. 54, 3165–3183 (2020).
Son, S.-W. et al. Extratropical prediction skill of the subseasonal-to-seasonal (S2S) prediction models. J. Geophys. Res. Atmos. 125, 569 (2020).
Yu, P. et al. Black carbon lofts wildfire smoke high into the stratosphere to form a persistent plume. Science 365, 587–590 (2019).
Kablick, G. P., Allen, D. R., Fromm, M. D. & Nedoluha, G. E. Australian PyroCb smoke generates synoptic-scale stratospheric anticyclones. Geophys. Res. Lett. 47, e2020GL088101 (2020).
Butler, A., Thompson, D. & Heikes, R. The steady-state atmospheric circulation response to climate change-like thermal forcings in a simple general circulation model. J. Clim. 23, 3474–3496 (2010).
Barnes, E. A. & Polvani, L. Response of the Midlatitude Jets, and of Their Variability, to Increased Greenhouse Gases in the CMIP5 Models. J. Clim. 26, 7117–7135 (2013).
Screen, J. A., Bracegirdle, T. J. & Simmonds, I. Polar climate change as manifest in atmospheric circulation. Curr. Clim. Change Rep. 4, 383–395 (2018).
Ayarzagüena, B. et al. Uncertainty in the response of sudden stratospheric warmings and stratosphere-troposphere coupling to quadrupled CO2 concentrations in CMIP6 models. J. Geophys. Res. Atmos. 125, 2077 (2020).
Manzini, E. et al. Northern winter climate change: assessment of uncertainty in CMIP5 projections related to stratosphere-troposphere coupling. J. Geophys. Res. Atmos. 119, 7979–7998 (2014).
Simpson, I. R., Hitchcock, P., Seager, R., Wu, Y. & Callaghan, P. The downward influence of uncertainty in the Northern Hemisphere stratospheric polar vortex response to climate change. J. Clim. 31, 6371–6391 (2018).
Previdi, M. & Polvani, L. M. Climate system response to stratospheric ozone depletion and recovery. Q. J. R. Meteorol. Soc. 140, 2401–2419 (2014).
Rao, J., Garfinkel, C. I. & White, I. P. Projected strengthening of the extratropical surface impacts of the stratospheric quasi-biennial oscillation. Geophys. Res. Lett. 47, 1 (2020).
Dee, D. et al. The ERA-Interim reanalysis: configuration and performance of the data assimilation system. Q. J. R. Meteorol. Soc. 137, 553–597 (2011).
Kalnay, E. et al. The NCEP/NCAR 40-year reanalysis project. Bull. Amer. Met. Soc. 77, 437–471 (1996).
Acknowledgements
Support from the Swiss National Science Foundation through project PP00P2_170523 to D.D. is gratefully acknowledged. A.B. was funded in part by NSF grant #1756958.
Author information
Authors and Affiliations
Contributions
D.D. initiated the study. D.D. and A.B. together designed the study, discussed the results, and contributed to the writing. Both authors contributed to making the figures.
Corresponding author
Ethics declarations
Competing interests
The authors declare no competing interests.
Additional information
Peer review information Primary handling editor: Heike Langenberg.
Publisher’s note Springer Nature remains neutral with regard to jurisdictional claims in published maps and institutional affiliations.
Rights and permissions
Open Access This article is licensed under a Creative Commons Attribution 4.0 International License, which permits use, sharing, adaptation, distribution and reproduction in any medium or format, as long as you give appropriate credit to the original author(s) and the source, provide a link to the Creative Commons license, and indicate if changes were made. The images or other third party material in this article are included in the article’s Creative Commons license, unless indicated otherwise in a credit line to the material. If material is not included in the article’s Creative Commons license and your intended use is not permitted by statutory regulation or exceeds the permitted use, you will need to obtain permission directly from the copyright holder. To view a copy of this license, visit http://creativecommons.org/licenses/by/4.0/.
About this article

Cite this article
Domeisen, D.I.V., Butler, A.H. Stratospheric drivers of extreme events at the Earth’s surface. Commun Earth Environ 1, 59 (2020). https://doi.org/10.1038/s43247-020-00060-z
Received:
Accepted:
Published:
DOI: https://doi.org/10.1038/s43247-020-00060-z
This article is cited by
-
Contrasting physical mechanisms linking stratospheric polar vortex stretching events to cold Eurasia between autumn and late winter
Climate Dynamics (2024)
-
Summer upper-level jets modulate the response of South American climate to ENSO
Climate Dynamics (2024)
-
Role of Stratospheric Processes in Climate Change: Advances and Challenges
Advances in Atmospheric Sciences (2023)
-
Boreal winter stratospheric climatology in EC-EARTH: CMIP6 version
Climate Dynamics (2023)
-
Modulation of a long-lasting extreme cold event in Siberia by a minor sudden stratospheric warming and the dynamical mechanism involved
Climate Dynamics (2023)
Comments
By submitting a comment you agree to abide by our Terms and Community Guidelines. If you find something abusive or that does not comply with our terms or guidelines please flag it as inappropriate.
