
Abstract
Colour polymorphism occurs when two or more genetically-based colour morphs permanently coexist within an interbreeding population. Colouration is usually associated to other life-history traits (ecological, physiological, behavioural, reproductive …) of the bearer, thus being the phenotypic marker of such set of genetic features. This visual badge may be used to inform conspecifics and to drive those decision making processes which may contribute maintaining colour polymorphism under sexual selection context. The importance of such information suggests that other communication modalities should be recruited to ensure its transfer in case visual cues were insufficient. Here, for the first time, we investigated the potential role of proteins from femoral gland secretions in signalling colour morph in a polymorphic lizard. As proteins are thought to convey identity-related information, they represent the ideal cues to build up the chemical modality used to badge colour morphs. We found strong evidence for the occurrence of morph-specific protein profiles in the three main colour-morphs of the common wall lizard, which showed both qualitative and quantitative differences in protein expression. As lizards are able to detect proteins by tongue-flicking and vomeronasal organ, this result support the hypothesis that colour polymorphic lizards may use a multimodal signal to inform about colour-morph.
Introduction
Among the most intriguing phenomena able to recursively animate the debate and to stimulate theoretical work in evolutionary biology, colour polymorphism (CP) surely occupies a good standing1,2. Its usually preferred definition, which somehow encloses the reason itself for the interest, is that of Huxley3, who slightly reformulated the original one by Ford4: CP occurs when two or more heritable colour morphs “coexist in temporary or permanent balance within a single interbreeding population […] in such frequencies that the rarer cannot be due solely to mutation”3. Colour is usually associated to other individual traits (physiological, morphological, ecological, reproductive, behavioural)1,5,6, resulting the most apparent attribute among a set of correlated ones1,5,6,7,8,9. Each morph can be viewed as an alternative combination of characters within a species, occupying a different peak in the adaptive landscape1. Understanding the mechanisms able to maintain (even “temporarily”) a balanced morph composition against recombination and genetic drift, which should operate in the opposite direction, has been viewed as the key for a deeper comprehension of evolutionary processes1,5,6,10,11,12,13,14.
Even if CP is generally regarded as any other polymorphism1,3, it intrinsically and inevitably pertains also to the sphere of animal communication15,16,17. When CP is driven by sexual selection, colour represents the visible badge of the underlying set of correlated traits6 and, as such, it is used to modulate the intra- and inter-specific interactions upon which CP maintenance is based9,18. Non-random pairing as well as morph-specific aggressiveness were often found to be the main behavioural mechanisms6,9, which require colour to be the intraspecific signal mediating decision-making processes18. In such contexts, communicating the own morph to conspecifics is advantageous to both signaller and receiver, and the morph-identity function of colour is therefore promoted and maintained19. Communication plays such a pivotal role in the mechanism that one could expect that other (even all) channels must be recruited to ensure its reliability and efficacy16,20,21. Indeed, some evidence of non-visual communication modalities matching colour morphs have been already found in orchids22,23,24, insects25,26, fish27,28,29, amphibians30,31, and lizards32,33,34. In all the above cases, the role of non-visual channel is to make the visual one more effective, ensuring that the message will be delivered when colour alone is not enough or cannot be detected35.
Lizards offer an ideal model to elucidate the interactions between visual and non-visual communication in association to CP. Firstly, CP is widespread and well-studied in this group6, and has been extensively used for theoretical works7,10,11,12,36,37,38,39. Secondly, as sexual selection and social strategies seem to play a major role in maintaining CP in lizards12,34,39,40,41,42,43,44,45,46, the need for an unbiased communication system is strengthened16,18,21,47,48. Finally, lizards have well-developed visual and chemical sensory systems, which constitute the hard-core of their social communication11,49,50,51,52,53,54,55,56,57,58. Notably, on the receiver side, chemoreception is powered by the vomeronasal organ associated to a forked tongue and the tongue-flicking behaviour58,59,60,61. On the signaller side, most lizards species have a series of specialized epidermal glands in the femoral and/or pre-cloacal region62,63,64 producing waxy secretions used to convey information about many signaller’s traits, like species65,66,67, sex68,69,70, identity71,72,73, familiarity50,74,75,76, status77,78,79,80, and condition81,82. Therefore, the chemical path comes as the ideal channel being combined to the visual modality explicitly recalled by CP.
Lizard femoral gland secretions are made of a mix of lipids and proteins83,84 whose relative proportion seems to vary with species considered84,85,86 and along the activity season, following androgen levels86,87. Unfortunately, only few data on a bunch of species are actually available63,73. The lipophilic fraction, which has been extensively studied, usually includes steroids, terpenes, provitamins (D and E), long chain acids, alcohols, esters, ketones, aldehydes, all being precursors, products or by-products of fat metabolism83,88. Given the cost they impose to the signaller, lipids have been hypothesized to honestly convey quality- and condition-related information used by conspecifics to make a decision in both intersexual (mate choice) or intrasexual interactions (male-male combats)53. For example, females of the well-studied lacertid lizard Iberolacerta monticola prefer territories marked by ergosterol-enriched scent of males with better immunity and condition89. Males are still able to assess fighting ability of the potential opponent based on the cholesterol level in the femoral secretions78. Similar evidences were also found in other lizard species65,90,91,92.
By contrast, the protein fraction is poorly known. The pioneering studies on the desert iguana (Dipsosaurus dorsalis) and the green iguana (Iguana iguana) showed that proteins could be used as signal, probably conveying identity-related information69,76,84,87, and support to such function has been recently confirmed for a lacertid species93. Combined to the expected strong relation between proteins and genes, these findings suggest that proteins may play an important role in individual recognition on a chemical basis63,73,94, which is a key pre-requisite in driving lizard social behaviour80,95,96. Since colour morph represents a genetic condition of the individual, not related to its body condition97, selection should promote the coevolution of: (i) an encoding system of the information about the signaller’s morph, especially in the protein fraction of the femoral gland secretions, and (ii) a decoding system of protein fraction associated to the vomeronasal organ54 of conspecific males or females. This would be the only way by which information may help individuals to drive behavioural choices and therefore contribute to the CP maintenance42,98.
To verify the hypothesis that proteins from femoral glands have the potential to convey information about colour morph, we analysed and compared the protein profiles from the three main morphs of the common wall lizard (Podarcis muralis)42,99. The ventral colouration (yellow, red/orange, and white) is genetically controlled100, and has been already correlated to many other traits41,43,101,102,103,104,105,106, even though a clear pattern has not still emerged. A potential environmental role in CP expression has been recently documented, suggesting that both natural and sexual selection may be involved in CP expression107,108. Nonetheless, the signal function of the ventral colouration is strongly supported by the morph assortative pairing42,45,46, by the morph-specific male-male interactions109,110, and by the lizard ability to discriminate colour morph18. Further, previous studies have already highlighted the occurrence of a chemical segregation of morphs41. Some lipophilic compounds, namely, tocopherol, are actually differentially allocated by morphs in the femoral pore secretions32, and 1-D electrophoretic runs performed on proteins of different populations of this species have shown an among-individuals variability in the profiles in terms of occurrence and intensity of some distinct protein bands73. However, the comparison and characterization of the proteins from the three main colour morphs have never been attempted. Here, differentially expressed proteins were detected and tentatively identified for the first time.
Results
Two-dimensional electrophoresis (2-DE)
The original gels from 2-DE are available as Supplementary Information. The master gels of W, Y and R morphs are shown in in the mid-line of Fig. 1, left to right, respectively. The mean spot number in the gels was 84, 53, and 55 for morphs W, Y, and R, respectively. The number of spots in W morph was about 1.5 fold higher than in R and Y.

Scheme of the two-dimensional electrophoresis analysis. Top: scanned images of the four gels obtained from each morph sample (original images are available as Supplementary Information); MG: master gel after PD Quest (Biorad) elaboration, representing the virtual gel associated to each morph (from left to right: white, yellow, red); HMG: high master gel obtained by the comparison of each MG pair (from left to right: W vs Y, W vs R, and Y vs R); bottom: combined high master gel (CHMG) obtained by superimposing the three HMGs to highlight those spots unique to each morph: red = W, green = Y, and blue = R.
The comparison of master gel patterns allowed to generate three new virtual images indicated as High Master Gels (HMG; Fig. 1) that evidenced these differences. In particular, the HMG generated by matching Y against W (Fig. 1) revealed that 47 (68.6%) spots were common to both phenotypes; 37 (27.0%) were unique of W and 6 (4.4%) exclusive of Y. Likewise, the HMG produced when R was matched against W (Fig. 1) showed that 40 (57.6%) spots were common to both phenotypes; 44 (31.7%) were exclusive of W and 15 (10.8%) of R. Finally, the HMG obtained from the comparison of Y and R master gels (Fig. 1) showed that these morphs had 32 (59.3%) spots in common; 21 (19.4%) were unique of Y and 23 (21.3%) of R. Taking advantage of the similarity among patterns, the three HMGs were correlated to each other (Y vs W; R vs W and R vs Y) to understand which were the spots common to all morphs and which unique to each of them. The same procedure mentioned above allowed the creation of the final virtual image indicated as CHMG (Fig. 1), comprehensive of all matched spots derived from the three HMGs.
Mass spectrometry (MS) analysis of differential proteins
As it can be seen from the magnified picture of CHMG (Fig. 2), a red, green, and blue colour was assigned by the software to spots exclusive of morph W, Y, and R, respectively. Among the spots peculiar of W morph, ten (numbered 1 to 10 in Fig. 2) were apparently not overlapping with others. The same for six spots unique to morph Y (numbered 11 to 16 in Fig. 2) and four unique to morph R (numbered 17 to 20 in Fig. 2). All these spots were carefully excised from the gel, destained, digested with trypsin and peptides submitted to MS analysis.

Position on the CHMG of the 20 excised spots finally used in mass spectrometry analysis. Numbers 1–10 belong to W, 11–16 to Y, 17–20 to R.
A scheme illustrating the peptide-spectrum matching results on the MS data is shown in Table 1. The low abundance of proteinaceous material under spot 2, 7, 8, 9, and 16 most likely determined the poor quality of their MS signals, which prevented any identification attempt. These spots were then excluded from the subsequent spectrum-to-spectrum comparisons. Seven spots (3, 5, 6, 12–14, 17) did not produce any match, the remnants eight gave a total of 14 identified peptides, seven unique to W, three to Y, and four to R. Six identified peptides matched proteins known to be linked to skin colour (Tables 1 and S3 in36). The lack of multiple peptide matches against a single protein prevented any identification at protein level.
The spectrum-to-spectrum comparison showed that there were no two identical spectra (105 pairwise comparison; Table 2) and highlighted the distinctness of the morph-specific spots (Fig. 3): the median “minimum non-self distance” was 0.963 (inter-quartile range = 0.567), while the median “self-distance” was 0.154 (inter-quartile range = 0.155). The difference is highly significant (Wilcoxon signed rank test: W = 0.000; P < 3.052·10−5; n = 15).
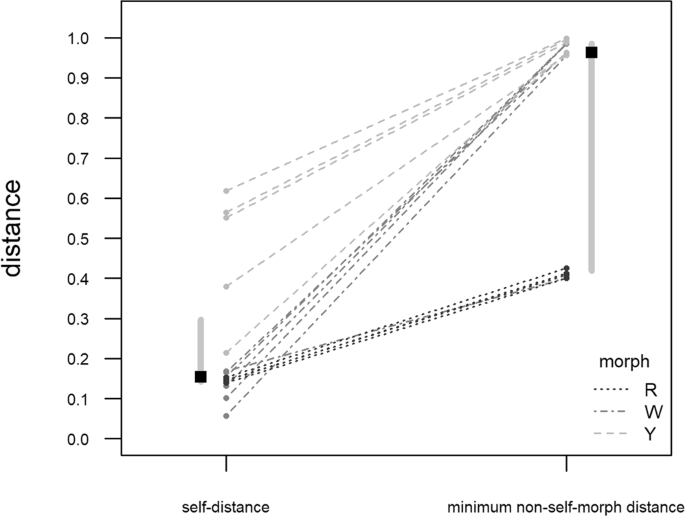
Comparison between the spectrum-to-spectrum distance of each analysed spot from itself (self-distance) and from the most similar spot among the ones belonging to a different morph (minimum non-self-morph distance). Values on the ordinate are cosine distance. Grey dots = observed distance value; dashed lines are used to link each self-distance to the corresponding non-self-morph. Black squares represent the medians of self- and non-self-morph distances; vertical grey bars show the interquartile range for each distance group.
Discussion
The proteinaceous content of the femoral pore secretions of Podarcis muralis appears well-differentiated among the three pure colour morphs, being W the richest in term of spot number (84 distinct spots), followed by R (55) and Y (53), which have similar scores. Out of 84, 15, 6, and 4 spots uniquely occur in W, Y and R, respectively. Even assuming these distinct spots could arise from protein under-expression rather than a true absence, the differences in the observed patterns are such as to allow easily discriminate each colour morph by 2-DE profiles alone (Fig. 1). Moreover, though not allowing protein identification, the MS data confirm that the differential spots hold unique peptides (Table 1; Fig. 3), making the 2-DE outcome further supported.
A similar match between chemical profile and colour morph has been already found in this species for the lipophilic part of the femoral gland secretions32. Whereas lipids are well-recognized chemical signals in lizard83, and relatively few studies have explicitly related proteins to inter-individual chemical communication93,111,112,113,114,115, the coherence between outcomes of the two studies on lipid and protein may be the result of a correlative effect: proteins simply form the non-informative matrix where lipids lie62,116, and, accordingly, any variation in lipid composition will be indirectly reflected in the protein one. This interpretation has a weak experimental support, though. The difference in lipid profiles is not as strong as that of proteins. Pellitteri-Rosa et al.32 found R-morph having relatively more tocopherol and less furanone than W, but only W showed a significant difference in the overall profile, and the attempt to classify morph on the lipids basis did not score well. This weakness can be explained considering that samples for the lipid study came from three distinct populations (no information are available about the site × morph frequency in the sample) over a period of two months (April to May). As both population and season can affect the composition and amount of the lipid fraction67,90,92,117,118,119,120,121, potentially in a morph-specific way43,44,122, an unbalanced sampling of morphs by period and population could have biased results. On the opposite, the observed differences in the protein pattern cannot be imputed to population, timing, or to sampling bias, since all sampled lizards came from the same site, were collected on the same day, at the peak of the breeding season43,86, and the pooled secretions were obtained by balancing the contribution of each donor (see Material and Methods). So, the stronger and more robust results from protein comparison are in contrast with what would be expected under a correlative hypothesis, which, at most, would have predicted the opposite, i.e., a stronger relation with lipids.
From a theoretical point of view, proteins look like a more probable candidate than lipids to convey information about morph, given morphs to represent equally adapted traits combinations5,7,9, genetically hereditable100, and unrelated to individual quality8,11, i.e., individual quality is still part of the story, but within each morph. Most lipids (or their precursors) from femoral glands cannot be synthetized ex-novo by lizards53,83,88. Rather, they are acquired from the environment, and impose a cost to their use in communication: this is exactly what a reliable quality signal does123, and evidences of such function have been already collected53,81,90,91,92,124,125. On the other side, proteins own an undoubted morph-specific profile, have a direct link with genes, do not impose an actual cost to the emitter (sensu Zahavi and Zahavi123), and can be detected by lizards69,93,126 thanks to the vomeronasal organ and taste. Altogether, these properties give the proteins the potential of being used as proxy for colour morph, as a part of a more complex chemical badge73,97,127. Future studies about the design of lizard chemical communication should hence adopt an integrated approach that simultaneously considers both chemical fractions of the signal, disentangle the unique information they carry, and investigate how they influence each other.
Finding a morph-specific pattern in proteins secreted by femoral gland has important consequences for the understanding of intra-specific interactions among free-ranging individuals of both sexes. Proteins are not volatile. When they are exploited as semiochemicals in terrestrial animals, they are usually in water solution (e.g., urine111,128) or directly transferred on the receiver chemoreceptive surfaces during close interactions (e.g., plethodontid salamanders129). In lizards, femoral gland secretions are typically left on dry substrates62,130, and the only way they can be detected is through the direct inspection, i.e., tongue-flicking54,59. Nevertheless, proteins are long-lasting stable marks (1-d electrophoresis of three-years-old samples gave the same results as freshly collected ones; Mangiacotti et al., unpubl.), and are among the most suitable signals in territorial contests131. Indeed, typically territorial species are able to recognize familiars on a chemical basis50,74,75,76,132, and also to build a spatial map of scent marking points133. In a CP system, assessing the morph identity of a potential rival or mate without (or before) seeing it (i.e., before the visual modality can be activated) may give a great advantage in decision-making and allows better tuning intraspecific interaction12,39. Indeed, non-random mating has been recognized as a key mechanism contributing to CP maintenance9, and it has been reported also for the common wall lizard42,45, where both male-male competition109,110,134 and female flexible choice45,135 seem to be at work. Combined with female preference for chemical rather than visual stimuli135, the occurrence of a dual modality (visual and chemical) of morph-specific signals gains even more importance.
Unfortunately, the identification of the involved proteins has not been achieved, thus preventing us to shed light on the mechanism behind morph chemical signalling. The lack of a specific and targeted database to match against MS spectra and the absence of previous knowledge about the composition of proteins from lizard femoral glands63,73 are probably the reasons for this trouble. The chosen database could have been hypothetically suitable, in that it pertained the skin gene expressions of a polymorphic lizard36, but retrieved sequences came from phylogenetic distant species, maybe too distant to give better results. Nonetheless it allowed the identification of some differential peptides, which, together with 2-DE and spectrum-to-spectrum comparison, is enough to fix that morph-specific proteins are actually present, which was the primary study aim. Now, more targeted work is needed to obtain a list of secreted proteins, to understand their role, also in relation to the lipophilic fraction, and the underlying mechanisms, in order to attempt a more multi-modal approach to animal communication.
The question of whether all the involved proteins (or only a few of them) have to do with differences among morphs’ chemical profiles rather than to other individual traits, as well as if lizards are actually able to discriminate morphs based on the protein fraction alone need to be proven by further molecular investigations and behavioural tests. The results of this pilot study just add a further step towards the comprehension of the mechanisms by which chemical and visual signalling cooperate in driving lizards’ communication and CP maintenance.
Materials and Methods
Sample collection
A total of 30 adult males (snout-to-vent length: mean = 64.7 mm; range: 59.0–71.0 mm136) of the common wall lizard Podarcis muralis have been considered in this study. Lizards were captured by noosing, which did not cause the animal avoidable pain, suffering, distress or lasting harm137. To minimize sample heterogeneity, all lizards were captured at the same site (Castelseprio, Lombardy, Italy: 45.73°N, 8.86°E, 358 m a.s.l.). Further, to avoid uncontrolled seasonal effects86, captures were concentrated on a single day (3rd April 2017), at the beginning of the breeding season, when glandular activity is at its maximum86 and males of the three morphs show comparable testosterone levels43. According to the differences in their ventral coloration (see Fig. 1 in99), lizards were assigned to one of the three pure morphs: white (W), yellow (Y), and red (R). Only lizards showing pure morphs were considered99. The final sample included ten individuals for each morph.
Femoral gland secretions were obtained from each individual by applying a gentle pressure around the thighs with the help of a small steel spatula, and collecting the protruding plugs directly into glass vials73. Lizards were then released at the capture point. Vials were transferred to the laboratory and samples preserved at −20 °C until analyses73.
No lizards were killed or injured during the study. Permits for capturing and handling lizards were granted by the Italian Ministry of Environment (Prot. Aut. PNM-2015-0010423; PNM-2016-0002154), who also approved sampling collection (which was not invasive and did not cause damage to any animal tissues).
Extraction and quantification of proteins
Secretions of male lizards femoral glands were pooled according to the morph. Proteins were extracted from waxy secretions through a defatting procedure73. In brief, 200 µL of n-hexane were added to samples (an average of 1–2 mg of proteins), incubated at room temperature for 2 h and, after centrifugation (14,000 rpm for 10 min), proteins were isolated as a pellet. The procedure was repeated three times and proteins were finally air-dried. Protein pellets were then dissolved in 200 µL of 10 mM PBS buffer pH 7.4, containing 137 mM NaCl and 2.7 mM KCl. Their exact quantification was achieved by applying the Bicinchoninic Acid (BCA) assay using bovine serum albumin (BSA) as the standard protein for the production of the calibration curve (in the range of concentration between 5 and 25 μg/mL). At this point, aliquots belonging to the individuals of the same group and containing a similar quantity of proteins were pooled, according to the morph. The protein concentration was about 2,5 mg/mL for each group of individuals and the total amount of proteins was about 1.0 mg/group.
Two-dimensional electrophoresis
Protocol set up
Samples were prepared by dissolving about 150 μg of proteins in 125 μL of rehydration buffer (8 M urea, 4% CHAPS (w/v), 65 mM DTE, 0.8% carrier ampholytes (v/v), 0.5% bromophenol blue). As 2-DE was never carried out before on proteins from lizard femoral glands, some preliminary attempts were made in order to attain a satisfactory outcome. Notably, the first dimension (isoelectric focusing - IEF) was run with linear and non-linear IPG strips, having the same pH range (pH 3–10; Amersham Biosciences, UK); for the second dimension the porosity of the SDS polyacrylamide gel was alternatively set to 12.5% or 15%.
Samples were first loaded onto 7 cm IPG strips, which were rehydrated without applying voltage for 1 h at 20 °C. IEF was carried out at 15 °C using an Ettan IPGphor system (Amersham Biosciences), programmed with the following voltage gradient: 30 V for 8 h, 120 V for 1 h, 500 V for 0.5 h, 1000 V for 0.5 h and 5000 V until a total of 25–27 kV/h was reached. Reduction/alkylation steps were applied between the first and the second dimension. The focused IPG strips were incubated for 15 min at room temperature in 6 M urea, 2% (w/v) SDS, 50 mM Tris pH 6.8, glycerol 30%, containing 2% (w/v) DTE, followed by a second incubation of 15 min in the same buffer containing 2.5% (w/v) iodoacetamide and 0.5% bromophenol blue. At the end of the IEF step, strips were hold in place with 0.4% low melting temperature agarose and loaded onto 8 × 6 cm slabs, 12.5% or 15% SDS polyacrylamide gels73. Electrophoresis was carried out at a constant current of 10 mA per gel in a PROTEAN II xi 2-D Cell equipment Bio-Rad (Berkeley, California), until the buffer frontline was 1 mm from the bottom of the gels. The 2-DE gels were stained with “Blue silver” (colloidal Coomassie G-250 staining)138. To minimize the technical mistakes connected with sample manipulation, experimental steps concerning sample preparation and electrophoretic runs were performed “in parallel” on all samples.
The visual inspection of the preliminary gels highlighted: (i) an unexpected overcrowding of spots being evident at the bottom of the slabs when using 12.5% porosity in second dimension; (ii) a lateral compression of spots, leaving a poorly coloured central area, when IEF used non-linear IPG strips. The best outcome, which minimized spot overlap and blank areas, was attained with linear strip and 15% porosity. Given the good resolution of spots, 2-DE analyses were performed in quadruplicate for each group (W, Y, R) using the above settings, to produce the 12 gels used in the final comparison (Fig. 1).
Gel analysis
Digital images of stained gels were acquired using the VersaDoc Imaging Model 3000 (BioRad) and then subjected to quali/quantitative analysis using the PD Quest (BioRad) version 8.0.1 software. Spot detection was achieved using the spot detection wizard tool after defining and saving a set of detection parameters. After spot detection, the original gel scans were filtered and smoothed to clarify spots, remove vertical and horizontal streaks and remove speckles. Three images were created from the process: the original raw 2-D scan, the Filtered image and the Gaussian image. A match set for each group was then created for comparison after the gel images had been aligned and automatically overlaid. If a spot was saturated, irregularly shaped, or otherwise of poor quality, then the Gaussian modelling was unable to accurately determine quantity. In these cases, the spot was defined in the filtered image using the spot boundary tools. Thus, for each group, a virtual image was produced which included protein spots only if present at least in two out of the three best gels. This is indicated as “master gel”.
Mass spectrometry analysis
In situ enzymatic digestion
The selected spots (Fig. 2) were carefully excised from the gel, placed into Eppendorf tubes and broken into small pieces. This material was then washed twice with aliquots (200 μL) of 100 mM ammonium bicarbonate buffer pH 7.8, 50% acetonitrile (ACN) and kept under stirring overnight, until complete destaining. Gels were dehydrated by addition of ACN (100 μL). After removal of the organic solvent, reduction was performed by addition of 50 μL of 10 mM Dithiothreitol (DTT) solution (40 min at 37 °C). DTT was replaced with 50 μL of 55 mM iodoacetamide for 45 min at 56 °C. This solution was removed and the gel pieces were washed twice with 200 μL of 100 mM ammonium bicarbonate for 10 min, while vortexing. The wash solution was removed and gel dehydrated by addition of 200 μL of ACN until the gel pieces became an opaque-white color. ACN was finally removed and gel pieces were dried under vacuum. Gels were rehydrated by addition of 75 μL of 100 mM ammonium bicarbonate buffer pH 7.8, containing 20 ng/μL sequencing grade trypsin (Promega, Madison, WI, USA) and digestion was performed overnight at 37 °C. Following enzymatic digestion, the resultant peptides were extracted sequentially from gel matrix by a three-step treatment (each step at 37 °C for 15 min) with 50 μL of 50% ACN in water, 5% trifluoroacetic acid (TFA) and finally with 50 μL of 100% ACN. Each extraction involved 10 min of stirring followed by centrifugation and removal of the supernatant. The original supernatant and those obtained from sequential extractions were pooled, dried and stored at −80 °C until mass spectrometric analysis. At the moment of use, the peptide mixture was solubilized in 100 μL of 0.1% formic acid (FA) for MS analyses.
LC-MS/MS
All analyses were carried out with a liquid chromatography-mass spectrometry (LC-MS, Thermo Finnigan, San Jose, CA, USA) system consisting of a thermostated column oven Surveyor autosampler controlled at 25 °C, a quaternary gradient Surveyor MS pump equipped with a diode array detector, and an Linear Trap Quadrupole (LTQ) mass spectrometer with electrospray ionization ion source controlled by Xcalibur software 1.4. Analytes were separated by reverse phase high performance liquid chromatography (RP-HPLC) on a Jupiter (Phenomenex, Torrance, CA,USA) C18 column (150 × 2 mm, 4 μm, 90 Å particle size) using a linear gradient (2–60% solvent B in 60 min) in which solvent A consisted of 0.1% aqueous FA and solvent B consisted of ACN containing 0.1% FA. Flow-rate was 0.2 mL/min. Mass spectra were generated in positive ion mode under constant instrumental conditions: source voltage 5.0 kV, capillary voltage 46 V, sheath gas flow 40 (arbitrary units), auxiliary gas flow 10 (arbitrary units), sweep gas flow 1 (arbitrary units), capillary temperature 200 °C, tube lens voltage–105 V. MS/MS spectra, obtained by CID studies in the linear ion trap, were performed with an isolation width of 3 Th m/z, the activation amplitude was 35% of ejection RF amplitude that corresponds to 1.58 V139.
Protein identification
Protein identification was attempted using a peptide-spectrum matching (PSM) approach140,141, as implemented in the MS-GF+ v2018.07.17 software142,143,144,145. According to the instrument sensibility, digestion protocols140,141, and general guidelines142, the algorithm settings were as follows: tolerance, 0.5 Da; charge range, 1–6+; range of peptide length, 6–35; isotope error 0–2 Da; cleavage, semi-tryptic; post translational modification, fix carbamidomethylation of cysteine140,146,147. The database choice is a crucial step in PSM, and, unfortunately the study species and the peculiarity of the protein samples prevented the extraction of an actually reliable dataset from the usual repositories148. So, an ad hoc database was built by taking advantage from the paper by McLean et al.36, where a list of differentially expressed genes at the skin level was made available for the colour morphs of the tawny dragon, Ctenophorus decresii (Table S3 in36). Even if the tawny dragon (Order Squamata, Fam. Agamidae) is not phylogenetically close linked to the common wall lizard (Order Squamata, Fam. Lacertidae), McLean’s and our study share these common main points: (i) they both involve polymorphic lizards; (ii) they both involve tissues with an epidermal origin; (iv) proteins conveying information about colour could derive from, or be related to, the same set of genes involved in skin colouration. The UniProt Knowledgebase release 2018_07149 was then surveyed for the 458 unique gene names available in Table S336, and the so-obtained entries were filtered out to match the vertebrate taxon. Further, to account for any contamination147, mammalian trypsin and human keratin sequences, also retrieved from UniProt, were added to the previous database. The final dataset counted 59,622 unique sequences.
To maximize power, PSM was run as a two-stage process150 with target-decoy approach. All the candidate proteins identified in the first stage (target or decoy) were used in the second stage to refine identification151, adjusting the proportion of target/decoy sequences to reach an unbiased estimation of false detection rate (FDR)151,152,153. Decoy sequences were obtained by reversing the target ones in both stages. FDR was calculated at the peptide level as ndecoy/ntarget for a given spectrum E-value, which was used as score151. Before FDR computation, the list of identified spectra was purged from all the spectra (i) simultaneously matching target and decoy sequences, (ii) corresponding to peptides with semi-tryptic cleavage, and iii) having more than two irregular cleavage151. Only spectra with FDR ≤ 0.01 were considered. A protein was considered identified if more than two different peptides match the same protein.
To further assess the effective distinctness of morph-specific spots, a pairwise spectrum-to-spectrum comparison was performed154,155,156. The set of spectra from each MS run was compared to all the others belonging to a different morph, and the cosine distance computed155. The minimum of this distances for each spot (minimum non-self-distance) was retained and compared to the one computed between each spot and itself (self-distance). A Wilcoxon signed rank test (one tail, with exact P estimation) was then used to assess if self-distance was significantly smaller than minimum non-self distance157, and to exclude spots identity.
All the above operations were implemented in R v3.5.0158, using the packages mzID159, Biostrings160, stringr161, functions by Rieder et al.155, and ad hoc functions (available upon request) to prepare database and call external software (MSGF+).
Data Availability
The scans of the best three 2-DE gels and MS raw data used in this study are available in Zenodo archive (https://doi.org/10.5281/zenodo.1460606).
References
Svensson, E. I. Back to basics: Using colour polymorphisms to study evolutionary processes. Molecular Ecology 26, 2204–2211 (2017).
Forsman, A. Is colour polymorphism advantageous to populations and species? Molecular Ecology 25, 2693–2698 (2016).
Huxley, J. Morphism and evolution. Heredity (Edinb). 9, 1–52 (1955).
Ford, E. B. Polymorphism. Biol. Rev. 20, 73–88 (1945).
Roulin, A. The evolution, maintenance and adaptive function of genetic colour polymorphism in birds. Biol. Rev. 79, 815–848 (2004).
McKinnon, J. S. & Pierotti, M. E. R. Colour polymorphism and correlated characters: Genetic mechanisms and evolution. Molecular Ecology 19, 5101–5125 (2010).
Sinervo, B. & Svensson, E. Correlational selection and the evolution of genomic architecture. Heredity (Edinb). 89, 329 (2002).
Gray, S. M. & McKinnon, J. S. Linking color polymorphism maintenance and speciation. Trends in Ecology and Evolution 22, 71–79 (2007).
Wellenreuther, M., Svensson, E. I. & Hansson, B. Sexual selection and genetic colour polymorphisms in animals. Mol. Ecol. 23, 5398–5414 (2014).
Mclean, C. A. & Stuart-Fox, D. Geographic variation in animal colour polymorphisms and its role in speciation. Biol. Rev. 89, 860–873 (2014).
Olsson, M., Stuart-Fox, D. & Ballen, C. Genetics and evolution of colour patterns in reptiles. Seminars in Cell and Developmental Biology 24, 529–541 (2013).
Sinervo, B. & Lively, C. M. The rock-paper-scissors game and the evolution of alternative male strategies. Nature 380, 240 (1996).
West-Eberhard, M. J. Alternative adaptations, speciation, and phylogeny (A Review). Proc. Natl. Acad. Sci. 83, 1388–1392 (1986).
Sánchez-Guillén, R. A. et al. The evolutionary history of colour polymorphism in Ischnura damselflies. J. Evol. Biol. 1–14, https://doi.org/10.1111/jeb.13289 (2018).
Endler, J. A., Westcott, D. A., Madden, J. R. & Robson, T. Animal visual systems and the evolution of color patterns: sensory processing illuminates Signal evolution. Evolution (N. Y.) 59, 1795–1818 (2005).
Bradbury, J. W. & Vehrencamp, S. L. Principles of animal communication. (Sinauer Associates, Inc., 2011).
Osorio, D. & Vorobyev, M. A review of the evolution of animal colour vision and visual communication signals. Vision Res. 48, 2042–2051 (2008).
Pérez i de Lanuza, G., Ábalos, J., Bartolomé, A. & Font, E. Through the eye of a lizard: hue discrimination in a lizard with ventral polymorphic coloration. J. Exp. Biol. jeb.169565, https://doi.org/10.1242/jeb.169565 (2018).
Johnstone, R. A. Recognition and the evolution of distinctive signatures: When does it pay to reveal identity? Proc. R. Soc. B Biol. Sci. 264, 1547–1553 (1997).
Marler, P. Animal Communication Signals. Science (80-.). 157, 769–774 (1967).
Alberts, A. C. Constraints on the design of chemical communication systems in terrestrial vertebrates. Am. Nat. 139, S62–S89 (1992).
Salzmann, C. C. & Schiestl, F. P. Odour and colour polymorphism in the food-deceptive orchid Dactylorhiza romana. Plant Syst. Evol. 267, 37–45 (2007).
Delle-Vedove, R. et al. Colour-scent associations in a tropical orchid: Three colours but two odours. Phytochemistry 72, 735–742 (2011).
Dormont, L., Delle-Vedove, R., Bessière, J. M. & Schatz, B. Floral scent emitted by white and coloured morphs in orchids. Phytochemistry 100, 51–59 (2014).
Osawa, N. & Nishida, T. Seasonal variation in elytral colour polymorphism in Harmonia axyridis (the ladybird beetle): the role of non-random mating. Heredity (Edinb), https://doi.org/10.1038/hdy.1992.129 (1992).
Frati, F., Piersanti, S., Conti, E., Rebora, M. & Salerno, G. Scent of a dragonfly: Sex recognition in a polymorphic coenagrionid. PLoS One 10, e0136697 (2015).
Blais, J. et al. Assortative mating among Lake Malawi cichlid fish populations is not simply predictable from male nuptial colour. BMC Evol. Biol. 9, 53 (2009).
Kekalainen, J. et al. The information content of odour, colour and tactile cues in the mate choice of minnows. Behaviour 148, 909–925 (2011).
Keller-Costa, T., Canário, A. V. M. & Hubbard, P. C. Chemical communication in cichlids: A mini-review. Gen. Comp. Endocrinol. 221, 64–74 (2015).
Brusa, O., Bellati, A., Meuche, I., Mundy, N. I. & Pröhl, H. Divergent evolution in the polymorphic granular poison-dart frog, Oophaga granulifera: Genetics, coloration, advertisement calls and morphology. J. Biogeogr. 40, 394–408 (2013).
Dreher, C. E. & Pröhl, H. Multiple sexual signals: calls over colors for mate attraction in an aposematic, color-diverse poison frog. Front. Ecol. Evol. 2, 1–10 (2014).
Pellitteri-Rosa, D. et al. Chemical polymorphism in male femoral gland secretions matches polymorphic coloration in common wall lizards (Podarcis muralis). Chemoecology 24, 67–78 (2014).
Vercken, E. & Clobert, J. The role of colour polymorphism in social encounters among female common lizards. Herpetol. J. 18, 223–230 (2008).
Lopez, P., Moreira, P. L. & Martin, J. Chemical Polymorphism and Chemosensory Recognition between Iberolacerta monticola Lizard Color Morphs. Chem. Senses 34, 723–731 (2009).
Moller, A. P. & Pomiankowski, A. Why have birds got multiple sexual ornaments? Behav. Ecol. Sociobiol. 32, 167–176 (1993).
McLean, C. A., Lutz, A., Rankin, K. J., Stuart-Fox, D. & Moussalli, A. Revealing the biochemical and genetic basis of colour variation in a polymorphic lizard. Mol. Biol. Evol. 16, 1–32 (2017).
Corl, A., Davis, A. R., Kuchta, S. R. & Sinervo, B. Selective loss of polymorphic mating types is associated with rapid phenotypic evolution during morphic speciation. Proc. Natl. Acad. Sci. USA 107, 4254–4259 (2010).
Sinervo, B. & Zamudio, K. R. The evolution of alternative reproductive strategies: fitness differential, heritability, and genetic correlation between the sexes. J. Hered. 92, 198–205 (2001).
Alonzo, S. H. & Sinervo, B. Mate choice games, context-dependent good genes, and genetic cycles in the side-blotched lizard, Uta stansburiana. Behav. Ecol. Sociobiol. 49, 176–186 (2001).
Sinervo, B., Bleay, C. & Adamopoulou, C. Social causes of correlational selection and the resolution of a heritable throat color polymorphism in a lizard. Evolution 55, 2040–2052 (2001).
Galeotti, P. et al. Colour Polymorphism and Alternative Breeding Strategies: Effects of Parent’s Colour Morph on Fitness Traits in the Common Wall Lizard. Evol. Biol. 40, 385–394 (2013).
De Lanuza, P. I., Font, G., Carazo, E. & Color-assortative, P. mating in a color-polymorphic lacertid lizard. Behav. Ecol. 24, 273–279 (2013).
Sacchi, R. et al. Seasonal variations of plasma testosterone among colour-morph common wall lizards (Podarcis muralis). Gen. Comp. Endocrinol. 240, 114–120 (2017).
Lattanzio, M. S., Metro, K. J. & Miles, D. B. Preference for male traits differ in two female morphs of the tree lizard, Urosaurus ornatus. PLoS One 9, e101515 (2014).
Sacchi, R. et al. Morph-specific assortative mating in common wall lizard females. Curr. Zool. 64, 449–453 (2018).
Pérez i de Lanuza, G., Font, E. & Carretero, M. Á. Colour assortative pairing in a colour polymorphic lizard is independent of population morph diversity. Naturwissenschaften 103, 82 (2016).
Endler, J. A. Some general comments on the evolution and design of animal communication systems. Philos. Trans. R. Soc. Lond. B. Biol. Sci. 340, 215–25 (1993).
Johnstone, R. A. Multiple Displays in Animal Communication:‘Backup Signals’ and ‘Multiple Messages’. Philos. Trans. R. Soc. B Biol. Sci. 351, 329–338 (1996).
Robinson, C. D., Patton, M. S., Andre, B. M. & Johnson, M. A. Convergent evolution of brain morphology and communication modalities in lizards. Curr. Zool. 61, 281–291 (2015).
Baird, T. A., McGee, A. A. & York, J. R. Responses to femoral gland secretions by visually adept male and female collared lizards. Ethology 121, 513–519 (2015).
Fox, S. F., McCoy, K. & Baird, T. A. Lizard social behavior. (Johns Hopkins University Press, 2003).
East, M. & Dehnhard, M. Chemical signals in vertebrates 12. (Springer, 2013).
Martín, J. & López, P. Condition-dependent chemosignals in reproductive behavior of lizards. Horm. Behav. 68, 14–24 (2015).
Schwenk, K. Of tongues and noses: chemoreception in lizards and snakes. Trends Ecol. Evol. 10, 7–12 (1995).
Pérez i de Lanuza, G. & Font, E. Ultraviolet vision in lacertid lizards: evidence from retinal structure, eye transmittance, SWS1 visual pigment genes and behaviour. J. Exp. Biol. 217, 2899–2909 (2014).
New, S. T. D., Hemmi, J. M., Kerr, G. D. & Bull, C. M. Ocular Anatomy and Retinal Photoreceptors in a Skink, the Sleepy Lizard (Tiliqua rugosa). Anat. Rec. 295, 1727–1735 (2012).
Jara, M. et al. The Macroecology of Chemical Communication in Lizards: Do Climatic Factors Drive the Evolution of Signalling Glands? Evol. Biol https://doi.org/10.1007/s11692-018-9447-x (2018).
Baeckens, S. et al. Evolutionary morphology of the lizard chemosensory system. Sci. Rep. 7, 10141 (2017).
Cooper, W. E. Chemical discrimination by tongue-flicking in lizards: A review with hypotheses on its origin and its ecological and phylogenetic relationships. J. Chem. Ecol. 20, 439–87 (1994).
Swaney, W. T. & Keverne, E. B. The evolution of pheromonal communication. Behav. Brain Res. 200, 239–47 (2009).
Witt, M. & Woźniak, W. Structure and function of the vomeronasal organ. Advances in Oto-Rhino-Laryngology 63, 70–83 (2006).
Cole, C. J. Femoral glands in lizards: a review. Herpetologica 22, 199–206 (1966).
Mayerl, C., Baeckens, S. & Van Damme, R. Evolution and role of the follicular epidermal gland system in non-ophidian squamates. Amphibia-Reptilia 36, 185–206 (2015).
Baeckens, S., Edwards, S., Huyghe, K. & Van Damme, R. Chemical signalling in lizards: an interspecific comparison of femoral pore numbers in Lacertidae. Biol. J. Linn. Soc. 114, 44–57 (2015).
Cooper, W. E. & Pèrez-Mellado, V. Pheromonal discriminations of sex, reproductive condition, and species by the lacertid lizard Podarcis hispanica. J. Exp. Zool. 292, 523–527 (2002).
Gabirot, M., Castilla, A. M., López, P. & Martín, J. Differences in chemical signals may explain species recognition between an island lizard, Podarcis atrata, and related mainland lizards, P. hispanica. Biochem. Syst. Ecol. 38, 521–528 (2010).
Runemark, A., Gabirot, M. & Svensson, E. I. Population divergence in chemical signals and the potential for premating isolation between islet- and mainland populations of the Skyros wall lizard (Podarcis gaigeae). J. Evol. Biol. 24, 795–809 (2011).
Baeckens, S., Driessens, T. & Van Damme, R. Intersexual chemo-sensation in a “visually-oriented” lizard, Anolis sagrei. PeerJ 4, e1874 (2016).
Alberts, A. C., Phillips, J. A. & Werner, D. I. Sources of intraspecific variability in the protein composition of lizard femoral gland secretions. Copeia 1993, 775–781 (1993).
Martín, J. et al. Chemical signals in desert lizards: Are femoral gland secretions of male and female spiny-tailed lizards, Uromastyx aegyptia microlepis adapted to arid conditions? J. Arid Environ. 127, 192–198 (2016).
Alberts, A. Pheromonal self-recognition in desert iguanas. Copeia 1992, 229–232 (1992).
Aguilar, P. M., Labra, A. & Niemeyer, H. M. Chemical self-recognition in the lizard Liolaemus fitzgeraldi. J. Ethol. 27, 181–184 (2009).
Mangiacotti, M. et al. Inter- and intra-population variability of the protein content of femoral gland secretions from a lacertid lizard. Curr. Zool. 63, 657–665 (2017).
Aragón, P. et al. Discrimination of Femoral Gland Secretions from Familiar and Unfamiliar Conspecifics by Male Iberian Rock-Lizards, Lacerta monticola. J. Herpetol. 35, 346 (2001).
López, P. & Martín, J. Chemical rival recognition decreases aggression levels in male Iberian wall lizards, Podarcis hispanica. Behav. Ecol. Sociobiol. 51, 461–465 (2002).
Alberts, A. C. & Werner, D. I. Chemical recognition of unfamiliar conspecifics by green iguanas: functional significance of different signal components. Anim. Behav. 46, 197–199 (1993).
López, P. & Martín, J. Male Iberian rock lizards may reduce the costs of fighting by scent matching of the resource holders. Behav. Ecol. Sociobiol. 65, 1891–1898 (2011).
Martín, J. & López, P. Scent may signal fighting ability in male Iberian rock lizards. Biol. Lett. 3, 125–127 (2007).
Martín, J., Moreira, P. L. & López, P. Status-signalling chemical badges in male Iberian rock lizards. Funct. Ecol. 21, 568–576 (2007).
Carazo, P., Font, E. & Desfilis, E. Chemosensory assessment of rival competitive ability and scent-mark function in a lizard, Podarcis hispanica. Anim. Behav. 74, 895–902 (2007).
López, P., Amo, L. & Martín, J. Reliable signaling by chemical cues of male traits and health state in male lizards, Lacerta monticola. J. Chem. Ecol. 32, 473–88 (2006).
López, P., Gabirot, M. & Martín, J. Immune activation affects chemical sexual ornaments of male Iberian wall lizards. Naturwissenschaften 96, 65–69 (2009).
Martín, J. & López, P. In Hormones and Reproduction of Vertebrates (eds Lopez, K. H. & Norris, D. O.) 141–167, https://doi.org/10.1016/B978-0-12-374930-7.10006-8 (Academic Press, 2011).
Alberts, A. C. Chemical properties of femoral gland secretions in the desert iguana, Dipsosaurus dorsalis. J. Chem. Ecol. 16, 13–25 (1990).
Escobar, C. A., Labra, A. & Niemeyer, H. M. Chemical Composition of Precloacal Secretions of Liolaemus Lizards. J. Chem. Ecol. 27, 1677–1690 (2001).
Mangiacotti, M. et al. Seasonal T-level fluctuations and protein content of femoral gland secretions in the common wall lizard (Podarcis muralis). In 19th SEH European Congress of Herpetology 104–105 (Facultas Verlags- und Buchhandels AG Wien, 2017).
Alberts, A. C., Pratt, N. C. & Phillips, J. A. Seasonal productivity of lizard femoral glands: Relationship to social dominance and androgen levels. Physiol. Behav. 51, 729–733 (1992).
Mason, R. T. & Parker, M. R. Social behavior and pheromonal communication in reptiles. J. Comp. Physiol. A 196, 729–749 (2010).
Martín, J., López, P., Gabirot, M. & Pilz, K. M. Effects of testosterone supplementation on chemical signals of male Iberian wall lizards: consequences for female mate choice. Behav. Ecol. Sociobiol. 61, 1275–1282 (2007).
Martín, J., Amo, L. & López, P. Parasites and health affect multiple sexual signals in male common wall lizards, Podarcis muralis. Naturwissenschaften 95, 293–300 (2008).
Khannoon, E. R., El-Gendy, A. & Hardege, J. D. Scent marking pheromones in lizards: Cholesterol and long chain alcohols elicit avoidance and aggression in male Acanthodactylus boskianus (Squamata: Lacertidae). Chemoecology 21, 143–149 (2011).
Kopena, R., López, P. & Martín, J. Relative contribution of dietary carotenoids and vitamin E to visual and chemical sexual signals of male Iberian green lizards: an experimental test. Behav. Ecol. Sociobiol. 68, 571–581 (2014).
Mangiacotti, M. et al. First experimental evidence that proteins from femoral glands convey identity related information in a lizard. Acta Ethol. 22, 57–65 (2019).
Alberts, A. C. Chemical and behavioral studies of femoral gland secretions in iguanid lizards. Brain. Behav. Evol. 41, 255–260 (1993).
Font, E., Barbosa, D., Sampedro, C. & Carazo, P. Social behavior, chemical communication, and adult neurogenesis: studies of scent mark function in Podarcis wall lizards. Gen. Comp. Endocrinol. 177, 9–17 (2012).
MacGregor, H. E. A. et al. Chemical communication, sexual selection, and introgression in wall lizards. Evolution (N. Y.), https://doi.org/10.1111/evo.13317 (2017).
Tibbetts, E. A., Mullen, S. P., Dale, J., Sp, M. & Tibbetts, E. A. Signal function drives phenotypic and genetic diversity: the effects of signalling individual identity, quality or behavioural strategy. Philos. Trans. R. Soc. London B Biol. Sci. 372 (2017).
Vercken, E., Massot, M., Sinervo, B. & Clobert, J. Colour variation and alternative reproductive strategies in females of the common lizard Lacerta vivipara. J. Evol. Biol. 20, 221–232 (2007).
Sacchi, R. et al. Colour variation in the polymorphic common wall lizard (Podarcis muralis): An analysis using the RGB colour system. Zool. Anz. 252, 431–439 (2013).
Andrade, P. et al. Regulatory changes in pterin and carotenoid genes underlie balanced color polymorphisms in the wall lizard. Proc. Natl. Acad. Sci. 116, 5633–5642 (2019).
Sacchi, R. et al. Morph-specific immunity in male Podarcis muralis. Amphibia-Reptilia 28, 408–412 (2007).
Sacchi, R., Mangiacotti, M., Scali, S., Ghitti, M. & Zuffi, M. A. L. Effects of Colour Morph and Temperature on Immunity in Males and Females of the Common Wall Lizard. Evol. Biol. 44, 496–504 (2017).
Scali, S. et al. Homeward bound: factors affecting homing ability in a polymorphic lizard. J. Zool. 289, 196–203 (2013).
Scali, S. et al. Does a polymorphic species have a ‘polymorphic’ diet? A case study from a lacertid lizard. Biol. J. Linn. Soc. 117, 492–502 (2016).
Sacchi, R., Scali, S., Mangiacotti, M., Sannolo, M. & Zuffi, M. A. L. In Reptile ecology and conservation. A handbook of techniques (ed. Dodd, K. C. J.) 59–72 (Oxford University Press, 2016).
Galeotti, P. et al. Sex-, morph- and size-specific susceptibility to stress measured by haematological variables in captive common wall lizard Podarcis muralis. Comp. Biochem. Physiol. - A Mol. Integr. Physiol. 157, 354–363 (2010).
Perez i de Lanuza, G. & Carretero, M. A. Partial divergence in microhabitat use suggests environmental-dependent selection on a colour polymorphic lizard. Behav. Ecol. Sociobiol. 72, 138 (2018).
Pérez i de Lanuza, G., Sillero, N. & Carretero, M. Á. Climate suggests environment-dependent selection on lizard colour morphs. J. Biogeogr. 00, 1–12 (2018).
Abalos, J., Pérez i de Lanuza, G., Carazo, P. & Font, E. The role of male coloration in the outcome of staged contests in the European common wall lizard (Podarcis muralis). Behaviour 153, 607–631 (2016).
Pérez i de Lanuza, G., Carretero, M. A. & Font, E. Intensity of male-male competition predicts morph diversity in a color polymorphic lizard. Evolution (N. Y.) 71, 1832–1840 (2017).
Lazar, J., Rasmussen, L. E. L., Greenwood, D. R., Bang, I. S. & Prestwich, G. D. Elephant albumin: A multipurpose pheromone shuttle. Chem. Biol. 11, 1093–1100 (2004).
Kikuyama, S., Yamamoto, K., Iwata, T. & Toyoda, F. Peptide and protein pheromones in amphibians. Comp. Biochem. Physiol. Part B Biochem. Mol. Biol. 132, 69–74 (2002).
Roberts, S. A., Davidson, A. J., Beynon, R. J. & Hurst, J. L. Female attraction to male scent and associative learning: the house mouse as a mammalian model. Anim. Behav. 97, 313–321 (2014).
Wyatt, T. D. Proteins and peptides as pheromone signals and chemical signatures. Anim. Behav. 97, 273–280 (2014).
Hurst, J. L. et al. Individual recognition in mice mediated by major urinary proteins. Nature 414, 631–634 (2001).
Padoa, E. Ricerche sperimentali sui pori femorali e sull’epididimo della lucertola (Lacerta muralis Laur.) considerati come caratteri sessuali secondari. Arch. ital. anat. embriol 31, 205–252 (1933).
Alberts, A. C., Sharp, T. R., Werner, D. I. & Weldon, P. J. Seasonal variation of lipids in femoral gland secretions of male green iguanas (Iguana iguana). J. Chem. Ecol. 18, 703–712 (1992).
Martín, J., López, P., Garrido, M., Pérez-Cembranos, A. & Pérez-Mellado, V. Inter-island variation in femoral secretions of the Balearic lizard, Podarcis lilfordi (Lacertidae). Biochem. Syst. Ecol. 50, 121–128 (2013).
Martín, J. & López, P. Interpopulational differences in chemical composition and chemosensory recognition of femoral gland secretions of male lizards Podarcis hispanica: Implications for sexual isolation in a species complex. Chemoecology 16, 31–38 (2006).
Heathcote, R. J. P., Bell, E., d’Ettorre, P., While, G. M. & Uller, T. The scent of sun worship: basking experience alters scent mark composition in male lizards. Behav. Ecol. Sociobiol. 68, 861–870 (2014).
García-Roa, R. et al. Interpopulational and seasonal variation in the chemical signals of the lizard Gallotia galloti. PeerJ 5, e3992 (2017).
Baeckens, S., Huyghe, K., Palme, R. & Van Damme, R. Chemical communication in the lacertid lizard Podarcis muralis: the functional significance of testosterone. Acta Zool. 98, 94–103 (2017).
Zahavi, A. & Zahavi, A. The Handicap Principle: A Missing Piece of Darwin’s Puzzle. Evolution and Human Behavior 117, (Oxford University Press, 1997).
Martín, J. & López, P. Links between male quality, male chemical signals, and female mate choice in Iberian Rock Lizards. Funct. Ecol. 20, 1087–1096 (2006).
López, P. & Martín, J. Female Iberian wall lizards prefer male scents that signal a better cell-mediated immune response. Biol. Lett. 1, 404–406 (2005).
Cooper, W. E. Responses to prey chemicals by a lacertid lizard, Podarcis muralis: Prey chemical discrimination and poststrike elevation in tongue-flick rate. J. Chem. Ecol. 17, 849–863 (1991).
Overath, P., Sturm, T. & Rammensee, H. G. Of volatiles and peptides: In search for MHC-dependent olfactory signals in social communication. Cellular and Molecular Life Sciences 71, 2429–2442 (2014).
Mucignat-Caretta, C. & Caretta, A. Message in a bottle: major urinary proteins and their multiple roles in mouse intraspecific chemical communication. Anim. Behav. 97, 255–263 (2014).
Woodley, S. Chemosignals, hormones, and amphibian reproduction. Horm. Behav. 68, 3–13 (2015).
Gabe, M. & Saint Girons, H. Contribution à la morphologie comparée du cloaque et des glandes épidermoides de la région cloacale chez les lépidosauriens. Mem. Mus. Natl. Hist. Nat. Paris, Ser. A Zool. 33, 149–292 (1965).
Vitt, L. J. & Pianka, E. R. Lizard ecology: Historical and experimental perspectives. Princeton University Press 10, (Princeton University Press, 1994).
Van Dyk, D. A. & Evans, C. S. Familiar-unfamiliar discrimination based on visual cues in the Jacky dragon, Amphibolurus muricatus. Anim. Behav. 74, 33–44 (2007).
Carazo, P., Font, E. & Desfilis, E. Beyond ‘nasty neighbours’ and ‘dear enemies’? Individual recognition by scent marks in a lizard (Podarcis hispanica). Anim. Behav. 76, 1953–1963 (2008).
Heathcote, R. J. P. et al. Male behaviour drives assortative reproduction during the initial stage of secondary contact. J. Evol. Biol. 29, 1003–1015 (2016).
Sacchi, R. et al. Common Wall Lizard Females (Podarcis muralis) do not Actively Choose Males Based on their Colour Morph. Ethology 121, 1145–1153 (2015).
Sacchi, R. et al. Studying the reproductive biology of the common wall lizard using ultrasonography. J. Zool. 287, 301–310 (2012).
Fitzgerald, L. A. In Reptile Biodiversity (eds McDiarmid, R., Foster, M., Guyer, C., Gibbons, J. & Chernoff, N.) 77–88 (University of California Press, 2012).
Candiano, G. et al. Blue silver: A very sensitive colloidal Coomassie G-250 staining for proteome analysis. Electrophoresis 25, 1327–1333 (2004).
Di Venere, M. et al. Ixodes ricinus and Its Endosymbiont Midichloria mitochondrii: A Comparative Proteomic Analysis of Salivary Glands and Ovaries. PLoS One 10, 1–16 (2015).
Eng, J. K., Searle, B. C., Clauser, K. R. & Tabb, D. L. A Face in the Crowd: Recognizing Peptides Through Database Search. Mol. Cell. Proteomics 10, R111.009522 (2011).
Nesvizhskii, A. I. Proteogenomics: concepts, applications and computational strategies. Nat Methods 11, 1114–1125 (2014).
Kim, S. & Pevzner, P. A. MS-GF+ makes progress towards a universal database search tool for proteomics. Nat. Commun. 5, 5277 (2014).
Granholm, V. et al. Fast and accurate database searches with MS-GF+ Percolator. J. Proteome Res. 13, 890–897 (2014).
Feng, X. et al. Using the entrapment sequence method as a standard to evaluate key steps of proteomics data analysis process. BMC Genomics 18, 143 (2017).
Kim, S., Gupta, N. & Pevzner, P. A. Spectral probabilities and generating functions of tandem mass spectra: A strike against decoy databases. J. Proteome Res. 7, 3354–3363 (2008).
Creasy, D. M. & Cottrell, J. S. Unimod: Protein modifications for mass spectrometry. Proteomics 4, 1534–1536 (2004).
Schittmayer, M., Fritz, K., Liesinger, L., Griss, J. & Birner-Gruenberger, R. Cleaning out the Litterbox of Proteomic Scientists Favorite Pet: Optimized Data Analysis Avoiding Trypsin Artifacts. J. Proteome Res. 15, 1222–1229 (2016).
Chen, C., Huang, H. & Wu, C. H. Protein bioinformatics databases and resources. Methods Mol. Biol. 1558, 3–39 (2017).
UniProt Consortium, T. UniProt: the universal protein knowledgebase. Nucleic Acids Res. 46, 2699–2699 (2018).
Craig, R. & Beavis, R. C. A method for reducing the time required to match protein sequences with tandem mass spectra. Rapid Commun. Mass Spectrom. 17, 2310–2316 (2003).
Jeong, K., Kim, S. & Bandeira, N. False discovery rates in spectral identification. BMC Bioinformatics 13(Suppl 1), S2–S2 (2012).
Everett, L. J., Bierl, C. & Master, S. R. Unbiased Statistical Analysis for Multi-Stage Proteomic Search Strategies. J. Proteome Res. 9, 700–707 (2010).
Bern, M. & Kil, Y. J. Comment on ‘unbiased statistical analysis for multi-stage proteomic search strategies’. J. Proteome Res. 10, 2123–2127 (2011).
Yllmaz, Ş. et al. A pipeline for differential proteomics in unsequenced species. J. Proteome Res. 15, 1963–1970 (2016).
Rieder, V. et al. DISMS2: A flexible algorithm for direct proteome- Wide distance calculation of LC-MS/MS runs. BMC Bioinformatics 18, 148 (2017).
Palmblad, M. & Deelder, A. M. Molecular phylogenetics by direct comparison of tandem mass spectra. Rapid Commun. Mass Spectrom. 26, 728–732 (2012).
Whitley, E. & Ball, J. Statistics review 06: Nonparametric methods. Crit. Care 6, 509–513 (2002).
R Core Team. R: A Language and Environment for Statistical Computing. (2018).
Pedersen, T. L., With contributions from Laurent Gatto, V. A. P. & Gibb., S. mzID: An mzIdentML parser for R (2016).
Pagès, H., Aboyoun, P., Gentleman, R. & DebRoy, S. Biostrings: Efficient manipulation of biological strings. R package version 2.46.0 (2017).
Wickham, H. Stringr: Simple, Consistent Wrappers for Common String Operations (2018).
Acknowledgements
This research was funded by the FRG 2016 (Ministry of Education, University and Research - MIUR) to Roberto Sacchi. We would like to thank Alan J. Coladonato (Department of Earth and Environmental Sciences, University of Pavia) and Mattia Falaschi (Department of Environmental Sciences, University of Milan) for their help in fieldwork, Roberta Salvini (Department of Molecular Medicine, University of Pavia) and Monica Di Venere for their suggestions in adjusting lab protocols, and prof. Paolo Iadarola (Department of Biology and Biotechnologies, University of Pavia) for his useful comments on an early draft of the manuscript.
Author information
Authors and Affiliations
Contributions
M.M., S.S. and R.S. conceived the ideas, collected the samples, and lead the writing of the manuscript; M.F., M.C., S.V., A.M.B. developed the lab protocols and performed lab analyses; M.M., M.F. and M.C. analyzed data. All authors critically supported the drafts and gave final approval for publication.
Corresponding author
Ethics declarations
Competing Interests
The authors declare no competing interests.
Additional information
Publisher’s note: Springer Nature remains neutral with regard to jurisdictional claims in published maps and institutional affiliations.
Supplementary information
Rights and permissions
Open Access This article is licensed under a Creative Commons Attribution 4.0 International License, which permits use, sharing, adaptation, distribution and reproduction in any medium or format, as long as you give appropriate credit to the original author(s) and the source, provide a link to the Creative Commons license, and indicate if changes were made. The images or other third party material in this article are included in the article’s Creative Commons license, unless indicated otherwise in a credit line to the material. If material is not included in the article’s Creative Commons license and your intended use is not permitted by statutory regulation or exceeds the permitted use, you will need to obtain permission directly from the copyright holder. To view a copy of this license, visit http://creativecommons.org/licenses/by/4.0/.
About this article

Cite this article
Mangiacotti, M., Fumagalli, M., Cagnone, M. et al. Morph-specific protein patterns in the femoral gland secretions of a colour polymorphic lizard. Sci Rep 9, 8412 (2019). https://doi.org/10.1038/s41598-019-44889-7
Received:
Accepted:
Published:
DOI: https://doi.org/10.1038/s41598-019-44889-7
This article is cited by
-
Carbonic anhydrase IV in lizard chemical signals
Scientific Reports (2023)
-
Multimodal female mate choice in a polymorphic flat rock lizard
Behavioral Ecology and Sociobiology (2022)
-
Proteins from femoral gland secretions of male rock lizards Iberolacerta cyreni allow self—but not individual—recognition of unfamiliar males
Behavioral Ecology and Sociobiology (2020)
-
Seasonal Variations in Femoral Gland Secretions Reveals some Unexpected Correlations Between Protein and Lipid Components in a Lacertid Lizard
Journal of Chemical Ecology (2019)
Comments
By submitting a comment you agree to abide by our Terms and Community Guidelines. If you find something abusive or that does not comply with our terms or guidelines please flag it as inappropriate.
