
Abstract
The northern state of Amazonas is among the regions in Brazil most heavily affected by the COVID-19 epidemic and has experienced two exponentially growing waves, in early and late 2020. Through a genomic epidemiology study based on 250 severe acute respiratory syndrome coronavirus 2 (SARS-CoV-2) genomes from different Amazonas municipalities sampled between March 2020 and January 2021, we reveal that the first exponential growth phase was driven mostly by the dissemination of lineage B.1.195, which was gradually replaced by lineage B.1.1.28 between May and June 2020. The second wave coincides with the emergence of the variant of concern (VOC) P.1, which evolved from a local B.1.1.28 clade in late November 2020 and replaced the parental lineage in <2 months. Our findings support the conclusion that successive lineage replacements in Amazonas were driven by a complex combination of variable levels of social distancing measures and the emergence of a more transmissible VOC P.1 virus. These data provide insights to understanding the mechanisms underlying the COVID-19 epidemic waves and the risk of dissemination of SARS-CoV-2 VOC P.1 in Brazil and, potentially, worldwide.
Main
Amazonas state reported the first confirmed SARS-CoV-2 case in Manaus, the state capital, in March 2020 in a traveler returning from Europe1. By late February 2021, >306,000 laboratory-confirmed cases and more than 10,400 deaths in Amazonas had been reported2. The COVID-19 epidemic in Amazonas is, at the time of writing, characterized by two exponentially growing curves of cases (Fig. 1a). Epidemiological data from surveillance of severe acute respiratory illness (SARI) and burials indicate that the first wave of the epidemic started in March 2020 and peaked around early May 2020, when the number of cases dropped and then remained roughly stable from June to November 2020. However, in mid-December the number of cases started to grow exponentially, establishing the second wave of the epidemic.

a, Graph depicting the temporal evolution of SARI cases and SARI deaths (based on date of symptom onset (source, http://info.gripe.fiocruz.br) and burials (source, SEMULSP-Manaus) as a proxy for the COVID-19 epidemic curve in Amazonas state, along with the number of SARS-CoV-2 whole-genome sequences generated in this study and samples genotyped by the P.1-specific real-time RT–PCR protocol. b, Map of Amazonas state showing municipalities covered by the SARS-Cov-2 sequences generated in this study. Numbers represent genomes generated for each municipality. c, Prevalence of major SARS-CoV-2 lineages between March 2020 and January 2021, estimated from whole-genome sequencing. d, Prevalence of SARS-CoV-2 lineages P.1 and non-P.1 between November 2020 and January 2021, estimated from whole-genome sequencing combined with RT–PCR screening.
A new SARS-CoV-2 VOC, designated P.1 and also knowns as N501Y.V3, recently emerged in Manaus. Lineage P.1 was first detected in four travelers returning to Japan from Amazonas state on 2 January 2021 (ref. 3) and was soon recognized as an emergent lineage in Manaus4. The VOC P.1 harbors 21 lineage-defining mutations, including ten in the Spike protein (L18F, T20N, P26S, D138Y, R190S, K417T, E484K, N501Y, H655Y and T1027I). The emergence of P.1 was touted as one of the putative causes of the second wave of COVID-19 in Manaus5. However, the precise relationship between circulating SARS-CoV-2 variants and epidemic dynamics in Amazonas remains unclear due to the paucity of viral sequences sampled in this Brazilian state before December 2020.
Results
Evidence of successive SARS-CoV-2 lineage replacements in Amazonas
To acquire a more in-depth understanding of the genetic diversity of SARS-CoV-2 variants circulating in Amazonas state since the early epidemic, we generated 250 SARS-CoV-2 high-quality, whole-genome sequences from individuals living in 25 municipalities, between 16 March 2020 and 13 January 2021 (Fig. 1a,b). Viral sequences were generated at FIOCRUZ Amazônia, which is part of both the Amazonas state health genomics network (REGESAM) and the consortium FIOCRUZ COVID-19 Genomics Surveillance Network of the Brazilian Ministry of Health (http://www.genomahcov.fiocruz.br/). Our genomic survey revealed that most sequences were classified into five lineages: B.1.1.28 (n = 93, 37%), P.1 (n = 60, 24%), B.1.195 (n = 49, 20%), B.1.1.33 (n = 29, 12%) and P.2 (n = 9, 4%) (Supplementary Table 1), with a changing temporal prevalence over time (Fig. 1c). The lineage B.1.195 was the most prevalent during the first exponential growth phase. However, its prevalence gradually decreased after the first epidemic peak in early May and was surpassed by lineage B.1.1.28. This lineage persisted as the most prevalent from May to December 2020, when the second lineage replacement took place coinciding with the second phase of exponential growth. The VOC P.1 was first detected on 4 December 2020 in Manaus, and displayed an extremely rapid increase in prevalence up to January 2021.
To better estimate the temporal trajectory of the emergence of P.1 in Amazonas state in late 2020 and early 2021, we designed a real-time PCR with reverse transcription (RT–PCR) screening assay to detect the deletion at orf1b (NSP6: S106del, G107del, F108del), which is a genetic signature of VOCs P.1, B.1.1.7 and B.1.351. Thus, we evaluated a further 1,232 SARS-CoV-2-positive samples available at the central laboratory of Amazonas state (LACEN-AM) between 1 November 2020 and 31 January 2021. None of the SARS-CoV-2-positive samples genotyped by real-time RT–PCR before 16 December was positive for the NSP6 deletion, supporting our sequencing results that indicate a very low prevalence of VOC P.1 before mid-December 2020 in Amazonas. However, positive samples for the NSP6 deletion were frequently detected in the second half of December 2020 and in January 2021. Combining genome sequencing and real-time RT–PCR testing, we found the P.1 lineage in 0% of samples collected in November 2020 (n = 0/355), in 8.6% of samples from 1 to 15 December 2020 (n = 33/384), in 50.8% of samples from 16 to 31 December 2020 (n = 177/348) and in 73.8% of samples from 1 to 15 January 2021 (n = 487/660) (Fig. 1d). Similar findings were observed when analyses were restricted to the city of Manaus: P.1 lineage in 0% of samples collected in November 2020 (n = 0/211), in 10.5% of samples from 1 to 15 December 2020 (n = 32/305), in 45.1% of samples from 16 to 31 December 2020 (n = 106/235) and in 66.0% of samples from 1 to 15 January 2021 (n = 163/247). These findings clearly show a sharp increase of lineage P.1 prevalence in Manaus, and in the countryside of Amazonas state, during the second epidemic wave.
Major SARS-CoV-2 local clades drove the COVID-19 epidemic in Amazonas state
To estimate the minimum number of viral introductions into Amazonas state, we performed maximum likelihood phylogeographic analyses for the large datasets of B.1.1.28 (n = 674) and B.1.1.33 (n = 602), and Bayesian analysis for the medium-sized B.1.195 dataset (n = 160). Time-scaled maximum likelihood trees support at least 28 importation events of widespread Brazilian lineages B.1.1.28 (n = 13), P.2 (n = 8) and B.1.1.33 (n = 7) into Amazonas state; mostly from the southeastern (75%) and southern (18%) Brazilian regions (Fig. 2a,b and Extended Data Fig. 1). Despite multiple seeding events, most B.1.1.28 and B.1.1.33 viruses from Amazonas state branched into three highly supported (approximate likelihood-ratio test >80%) local clades (Fig. 2a,b). The clades 28-AM-I and 28-AM-II comprised 49% (n = 46) and 26% (n = 24) of all B.1.1.28 sequences from Amazonas, respectively, and clade 28-AM-II further gave origin to lineage P.1. The clade 33-AM-I comprises 48% (n = 14) of all B.1.1.33 sequences from Amazonas detected here. A Bayesian phylogeographic tree of B.1.195 sequences, sampled worldwide, supports a single importation event of this lineage into Amazonas state from either other Brazilian states or abroad (posterior probability = 0.61 and 0.39, respectively) (Fig. 2c). The clustering of B.1.195 Amazonian sequences in a single, highly supported (posterior probability = 0.92) monophyletic clade (195-AM) was resolved after incorporation of a nine-nucleotide deletion at nsp1 (delta 640–648: K141, S142, F143) as an informative trait in phylogenetic reconstruction. This deletion was the only lineage-defining molecular signature of clade 195-AM, and was also detected in two sequences from the Colombian Amazonian region and one from a Japanese traveler returning from Amazonas to Japan, which were nested within clade 195-AM.

a,b, Maximum likelihood phylogeographic analysis of lineages B.1.1.28/P.1/P.2 (a) and B.1.1.33 (b) in Brazil. Graphs depict the estimated numbers of introductions into Amazonas state, colored by region of origin. c, Bayesian phylogeographic analysis of lineage B.1.195 sequences sampled worldwide. Tips and branches are colored according to sampling location and the most probable location state of their descendent nodes, respectively, as indicated in the legend. Shaded boxes highlight the major SARS-CoV-2 Amazonian clades. The trees were automatically rooted under the assumption of a strict molecular clock, and all horizontal branch lengths are drawn to a scale of years.
Analysis of the identified Amazonian clades revealed single-lineage-defining mutations in clades 28-AM-I (C29284T), 28-AM-II (A6613G) and 33-AM-I (A28108C, ORF8:Q72P) relative to other B.1.1.28 and B.1.1.33 Brazilian sequences. Furthermore, only one signature mutation at the Spike (V1176F) distinguishes Amazonian lineages B.1.195 and B.1.1.28, which contrasts with the high number of mutations accumulated by the lineage P.1. A closer inspection of the genetic diversity within the Amazonian clade 28-AM-II further revealed a P.1-like sequence sampled in Manaus on 23 December 2020 that branched basal to the P.1 lineage and also accumulated an unusually high number of genetic changes relative to other B.1.1.28 Brazilian sequences (Fig. 3a). The P.1-like sequence harbors 6/10 P.1 lineage-defining mutations in the Spike protein, including those at the receptor-binding domains K417T, E484K and N501Y. Those mutations raise concern because they may enhance ACE2 affinity and contribute to antibody evasion (Supplementary Table 2)6. To investigate the events underlying the emergence of P.1 and P.1-like lineages, we analyzed intrahost SARS-CoV-2 variability in our samples. We found a total of 484 well-supported minor variants (MVs) with a predominance of nonsynonymous (n = 368) over synonymous (n = 105) substitutions in 126 out of 250 genomes analyzed in this study (Fig. 3b). The frequency of MVs observed in samples taken during the early (March–September) and late (October–January) epidemic phases was comparable (Extended Data Fig. 2), and no MVs corresponding to the Spike-lineage-defining mutations of clades P.1 and P.1-like were identified (Supplementary Table 3).

a, Correlation between the sampling dates of B.1.1.28, P.1 and P.2 Brazilian sequences and their genetic distance from the root of the maximum likelihood phylogenetic tree. The tree is rooted using the oldest sequence. Sequences from Amazonian clades and VOCs are colored according to the legend at left. b, Maximum likelihood phylogenetic tree of the 250 genomes from Amazonas, with lineage assignment and total (black), nonsynonymous (red) and synonymous (blue) nucleotide changes estimated when incorporating MVs into the consensus genome.
Differences in the epidemic trajectory of major SARS-CoV-2 Amazonian clades
Bayesian reconstructions of the spatiotemporal dissemination dynamic, using different molecular clocks (strict and local) and phylogeographic (continuous and discrete) models, support very similar scenarios (Supplementary Tables 4 and 5). These analyses support that the early prevalent local clade 195-AM probably emerged in mid-March 2020 in the city of Manaus and quickly spread from there to several municipalities of the metropolitan region and inner Amazonas state (Fig. 4a,b). The origin of clades 28-AM-I and 28-AM-II was estimated to be in late March 2020 in the area of the Solimões river comprising the municipalities Manacapuru, Iranduba and Manaquiri, and from this area these clades were disseminated to Manaus and other inner municipalities (Fig. 4c–f). The clade 33-AM-I probably arose in mid-April 2020 and remained restricted to Manaus. These analyses traced the most recent common ancestor of lineages P.1 and P.1-like to Manaus in late August 2020, and further indicate that the VOC P.1 probably arose in Manaus around late November 2020 and rapidly spread to other municipalities of the metropolitan region, and also to municipalities located up to 1,100 km distant from Manaus at the borders with Peru, Colombia and Venezuela (Fig. 4e,f).

a–f, Phylogeny branches were arranged in space according to internal node locations inferred by the continuous phylogeographic model for lineages 195-AM (a,b), 28-AM-I (c,d) and 28-AM-II (e,f). Branches are colored according to time, as indicated by the legend. Blue shaded areas depict the phylogeographic estimation uncertainty as the 80% highest posterior density interval of the nodes. b,d,f, Close-up views of migration events in the Manaus metropolitan area for each lineage. Stars represent the estimated location of the most recent common ancestor of each lineage; squares represent nodes comprising the P.1 lineage.
We next applied the birth–death skyline (BDSKY) model to estimate the effective reproductive number (Re) of the Amazonian clades with >40 genomes. The estimated Re trajectories matched the relative prevalence of lineages and social distancing metrics (Fig. 5) very closely. The Re of clade 195-AM was high (2.6, 95% highest posterior density (HPD): 1.6–3.8) in March, but displayed a steep decrease to 1.0 (95% HPD): 0.8–1.2) in April, coinciding with an increase by >50% of social distancing in Manaus. Clade 28-AM-I, which was estimated to have emerged in rural Amazonas municipalities, also presented a high Re (2.1, 95% HPD: 1.2–3.4) in its initial spread, reducing to 0.9 (95% HPD: 0.7–1.2) in May when the social distancing index reached 50% in the interior of Amazonas state. The increasing relative prevalence of clade 28-AM-I over 195-AM from April to June agrees with the estimated Re differences during April. From June to August 2020, the Re of clades 195-AM and 28-AM-I remained roughly stable at around 1.0. When the social distancing index decreased to <40% in September 2020, 195-AM became apparently extinct while the Re of 28-AM-I increased to 1.2 (95% HPD: 0.9–1.6) and then remained roughly stable >1.0 up to the end of 2020, leading to an increasing prevalence of 28-AM-I between September and November 2020. The lineage P.1 arose in late November 2020 and displayed a high Re of 2.6 (95% HPD: 1.5–4.5) during December 2020, becoming the predominant lineage. With the consequently increased social distance imposed after the health system collapse, this VOC’s Re was estimated to have decreased to 1.2 (95% HPD: 0.9–1.6) in late December and January.

a, Relative prevalence of viral Amazonian clades between March 2020 and January 2021 estimated from whole-genome sequencing. b, Graph depicting the temporal variation in Re of viral Amazonian clades, estimated using the BDSKY approach along with social distancing data trends, reported as percentage change measured against baseline in Manaus (dashed line) and outside Manaus (solid line). Lines represent the weekly average (source, http://inloco.com.br).
SARS-CoV-2 P.1 infections are associated with higher viral loads
The estimated Re trajectories of SARS-CoV-2 Amazonian lineages support that VOC P.1 could be more transmissible than the earlier prevalent viral lineages. To test whether this estimated Re difference might reflect a distinct virological phenotype, we used real-time RT–PCR cycle threshold (Ct) scores as a proxy of the viral load in the upper respiratory tract (URT) of P.1-positive and -negative samples collected at a similar time point of symptom onset (Fig. 6 and Supplementary Table 6). Our analysis revealed a significantly (Mann–Whitney two-sided test P < 0.0001) lower median score in URT samples from P.1-infected (Ct = 19.8) compared with non-P.1-infected (Ct = 23.0) subjects, indicating that viral load was ~tenfold higher in P.1 infections than in non-P.1. The median Ct scores for P.1 were significantly lower than for non-P.1 in adult (18–59 years) men (P = 0.0005), adult women (P < 0.0001) and elderly (>59 years) women (P = 0.0149), but not significantly different in elderly men (P = 0.4624). Non-P.1-infected elderly men displayed higher viral load (Ct = 20.8) than younger male adults (Ct = 22.7) and females of all ages (Ct = 23.8). Older P.1-infected males, by contrast, displayed viral load (Ct = 19.8) similar to younger adult males (Ct = 19.4) and females of all ages (Ct = 20.1), suggesting that P.1-infected individuals >18 years old could be equally infectious, irrespective of sex and age.
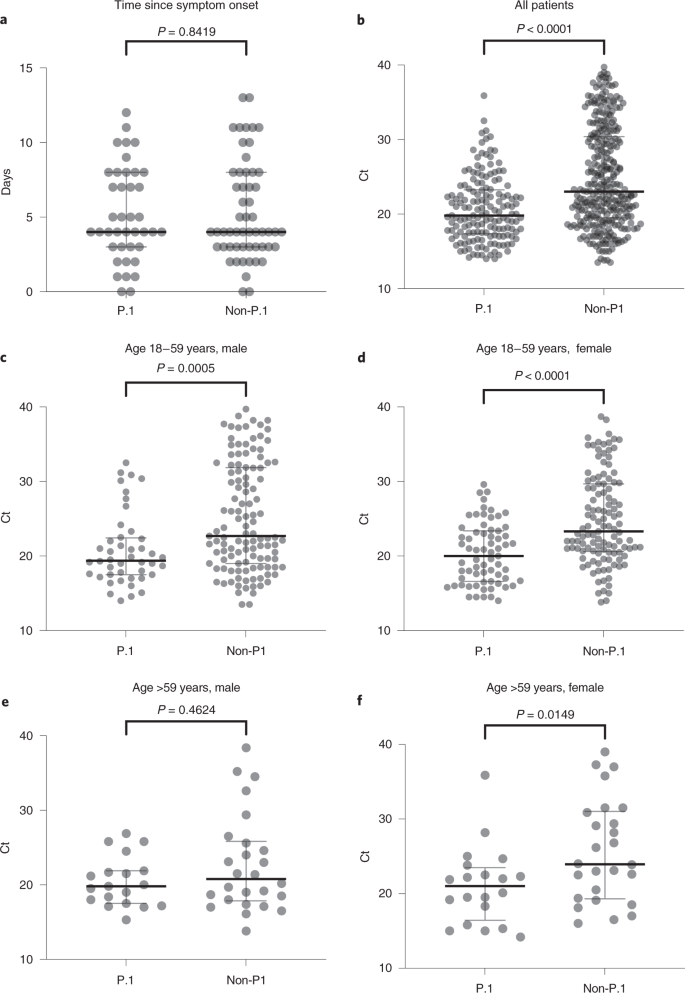
a–f, Evaluation of sample collection time from the onset of symptoms between groups for those samples with available information: n = 96 (40 P.1, 56 non-P.1) (a), n = 464 (157 P.1, 307 non-P.1) (b), n = 161 (44 P.1, 117 non-P.1) (c), n = 184 (67 P.1, 117 non-P.1) (d), n = 45 (19 P.1, 26 non-P.1) (e) and n = 46 (20 P.1, 26 non-P.1) (f). Comparison of Ct values among different groups by sex and age range. Horizontal bars represent Ct medians and IQR. Two-sided P values for the nonparametric Mann–Whitney test are shown for each group. Exact P values are shown above, apart from those <0.0001; two-sided P values <0.05 were considered statistically significant.
Discussion
The present study is a comprehensive SARS-CoV-2 genomic investigation performed in Amazonas, one of the Brazilian states most heavily impacted by COVID-19. Our analyses revealed that most cases in Amazonas were driven by successful dissemination of a few local viral clades that, together, comprise 77% of the 250 SARS-CoV-2 Amazonian genomes sampled between March 2020 and January 2021 rather than multiple importation events. Early major SARS-CoV-2 Amazonian clades arose in either Manaus or the metropolitan region between mid-March and late April 2020 and were widely disseminated within Amazonas state, reaching the most isolated inner localities. We found almost no evidence of the spread of early local SARS-CoV-2 Amazonian lineages outside the state, supporting that Amazonas was not a major hub of viral dissemination within Brazil during 2020. Increasing travel during Christmas and New Year celebrations, combined with the emergence of a potentially more transmissible VOC, however, have changed this scenario, and lineage P.1 has rapidly spread across several Brazilian states up to March 2021 (http://www.genomahcov.fiocruz.br).
Two SARS-CoV-2 lineage replacements characterized the COVID-19 epidemic in Amazonas during early and late 2020. The first of these started after the primary epidemic peak and was a gradual process over nearly 5 months during which lineage B.1.1.28 progressively substituted lineage B.1.195, which was the dominant variant during the first epidemic wave. Our analyses suggest that epidemiological rather than virological factors probably drove this first lineage replacement. The SARS-CoV-2 Amazonian clades 28-AM-I and 28-AM-II, which became the dominant variants in the phase between peaks, displayed only single-lineage-defining synonymous mutations with one difference at the Spike protein when compared to clade 195-AM, and these evolved at a relatively constant rate between April and November 2020. The most notable difference was that clade 195-AM arose in the city of Manaus, and the Re value was considerably reduced around mid-April when social distancing in Manaus increased to >50%. Clades 28-AM-I and 28-AM-II, by contrast, arose outside the city of Manaus and the Re of clade 28-AM-I remained >1.0 until mid-May 2020, when social distancing outside the capital city increased to >50%. When mitigation measures were relaxed and the social distancing index fell by <40% in September 2020, the Re of clade 28-AM-I returned to >1.0 while clade B.1.195 became extinct, completing the lineage replacement process. Thus, the lower social distancing observed in Amazonas state inner municipalities compared to Manaus was the probable driver of the first lineage replacement.
A modeling study with data from blood donors, conducted in Manaus, estimated that the first wave of SARS-CoV-2 infected 76% (95% CI: 67–98) of the city’s population by October 2020, suggesting that the theoretical threshold for herd immunity was reached by mid-2020 and that a second COVID-19 wave would not be expected so soon7. Several hypotheses were proposed to explain the unexpected second wave that resulted in the collapse of the health system in Manaus between December 2020 and January 2021 (ref. 5). One hypothesis is that lineage P.1 might evade immunity generated in response to a previous infection and has the potential to reinfect convalescent individuals. While some cases of reinfection with lineage P.1 were described in Manaus8, the extent to which reinfections effectively contribute to both onward transmission of SARS-CoV-2 and the surge of cases in the second wave in Amazonas remains controversial4,9. Another hypothesis is that the SARS-CoV-2 attack rate in Manaus was overestimated. Our study supports that a drastic reduction in median Re (from 2.1–2.6 to 0.9–1.0) for Amazonian lineages B.1.195 and B.1.1.28 occurred around April-May 2020, consistent with independent epidemiological modeling studies10,11, coinciding with the timing of implementation of nonpharmaceutical interventions (NPI) that effectively increased social distancing. Although those NPIs were not sufficiently stringent to consistently reduce Re to <1.0, they maintained a stationary state of low endemic viral community transmission from May to September 2020 (refs. 10,11). These findings support that the NPIs implemented in Amazonas brought the first epidemic wave under relative control before herd immunity became established, and were sufficiently effective to provide population ‘herd protection’ until December 2020 (ref. 11).
Mitigation measures were relaxed from September 2020 onwards, and the Re of clade 28-AM-I returned to >1.0. Nevertheless, the second epidemic wave started only in December 2020, coinciding with the emergence of the VOC P.1 and the second lineage replacement event. Several complementary evidences support that these events were probably driven by the emergence of a more transmissible variant in a context of relaxed social distancing. First, the second lineage replacement event was an abrupt process because the VOC P.1 emerged around late November 2020 and it required <2 months to become the dominant variant in Amazonas. This epidemiologic trajectory was later reproduced in other Brazilian states (http://www.genomahcov.fiocruz.br/). Second, the estimated median Re of the VOC P.1 during December 2020 was 2.2-fold higher than that estimated for clade 28-AM-I in the same period, indicating that P.1 could have been nearly twofold more transmissible than the co-circulating B.1.1.28 parental lineage, consistent with two recent independent studies4,9. Third, the level of SARS-CoV-2 RNA (estimated from the median Ct) in the URT samples from P.1 infections, particularly from adults (18–59 years), was ~tenfold higher than the level detected in non-P.1 infections, suggesting that P.1-infected adult individuals are more infectious than those harboring non-P.1 viruses4,9. Fourth, recent experimental evidence supports that VOC P.1 displayed both higher affinity for the human receptor ACE2 and increased resistance to antibody neutralization6,12,13,14, which might provide a substantial selective advantage for transmission of P.1 over other lineages.
Understanding the factors that drive the emergence and expansion of VOCs harboring multiple key mutations in the receptor-binding domain of the Spike protein is of crucial importance. One hypothesis is that the emergence of VOCs resulted from a major change in the selective environment, probably imposed by partial herd immunity in heavily affected regions within which SARS-CoV-2 was evolving15. Our study of the Amazonian clades that locally evolved between April and December 2020, however, revealed no unusual patterns of intra- or interhost viral variability, showing that the local emergence of VOC is an evolutionary event that is challenging to anticipate from the analysis of parental lineages. Another hypothesis is that VOCs result from selective pressures and adaptation of the virus during prolonged individual infections16. However, the identification—in our study and during subsequent surveillance conducted in Manaus between December 2020 and January 2021 (ref. 17)—of P.1-like viruses that harbor several of the P.1 lineage-defining mutations indicates that P.1 mutations did not accumulate in a single, long-term infection but were acquired in sequential steps as observed in the VOC B.1.351 (ref. 18). The finding that P.1 and P.1-like viruses probably share a most recent common ancestor in late August 2020 further supports that SARS-CoV-2 variants carrying mutations of concern had circulated in Manaus for some time before the emergence of lineage P.1. Although only the lineage P.1 seems to have displayed a rapid dissemination to date, our findings alert for the potential spread of other P.1-related VOC in Amazonas state, or in other Brazilian states.
It is important to stress that our study has some limitations. First, biased sampling across Brazilian states might influence phylogeographic reconstructions of within-country B.1.128 and B.1.1.33 lineage migrations, so the inferred number of importations into Amazonas should be interpreted as lower-bound estimates. Second, within-country spread of lineages B.1.1.28 and B.1.1.33 was inferred using a machine learning phylogeographic approach that does not account for uncertainty in phylogenetic reconstruction, and thus the routes of viral migration described here are plausible hypotheses among alternatives not fully explored in our analyses. Third, estimates of Re obtained here may be influenced by local epidemiological dynamics, making it challenging to extrapolate the difference in viral transmissibility between P.1 and non-P.1 variants observed in Amazonas to other geographic regions. Fourth, although we removed potential confounders (for example, comparison of only PCR results using the same RNA extraction/real-time RT–PCR protocols and sampled at similar timepoints from symptom onset), Ct comparisons have weaknesses and must be analyzed with caution. VOC P.1 may cause more prolonged infections with a similar peak in viral concentration than non-P.1 lineages, as was recently described for B.1.1.7 (ref. 19). Moreover, we have no data regarding disease severity for group comparison. Therefore, the difference observed here should be confirmed in other geographic settings, including analysis of Ct dynamics in longitudinal sampled patients with different disease outcomes.
In summary, our findings support that lineage replacements were a recurrent phenomenon in the local evolution of SARS-CoV-2 in Amazonas state, driven by ecological and virological factors. Our findings also indicate that NPIs deployed in Amazonas state in April 2020 were sufficiently effective to reduce the Re of early prevalent local SARS-CoV-2 clades but were insufficient to keep the epidemic under control, allowing the establishment and local persistence of several endemic viral lineages and subsequent emergence of the VOC P.1 in late November/early December 2020. The lack of efficient social distancing and other mitigation measures probably allowed a sudden and accelerated transmission of VOC P.1. At the same time, the higher transmissibility of this VOC further fueled the rapid upsurge in SARS-CoV-2 cases and hospitalizations observed in Manaus following its emergence. Importantly, phylodynamic modeling indicates that NPIs implemented in Manaus since early January 2021 (Supplementary Note) effectively reduced the median Re of the VOC P.1 by approximately 50%. Therefore, our results suggest that weak adoption of NPIs represents a risk for the continuous emergence of new variants. Implementation of efficient mitigation measures, combined with widespread vaccination, will be crucial to controlling the spread of SARS-CoV-2 VOCs in Brazil.
Methods
SARS-CoV-2 samples and ethical aspects
We collected nasopharyngeal and pharyngeal swabs from 644 residents in Amazonas state with available demographic data (320 male, median age 44 years (interquartile range (IQR) = 31.0–57.7); 324 female, median age 43 years (IQR = 30.2–56.0)) that were positively tested by real-time RT–PCR as a routine diagnostic for COVID-19 using any of the following commercial assays: SARS-CoV2 (E/RP) (Biomanguinhos), Allplex 2019-nCoV Assay (Seegene) or an in-house protocol following US Centers for Disease Control and Prevention (CDC) guidelines (https://www.fda.gov/media/134922/download). Among those 644 nasopharyngeal and pharyngeal swab samples, 250 were submitted to nucleotide sequencing and 394 were evaluated only for P.1/VOCs by the real-time RT–PCR developed in this study. Fiocruz/ILMD is one of the official laboratories designated for SARS-CoV-2 testing under the auspices of a network coordinated by the Amazonas State Health Foundation (FVS-AM) and the Brazilian Ministry of Health. This study was conducted at the request of the SARS-CoV-2 surveillance program of FVS-AM. It was approved by the Ethics Committee of Amazonas State University (no. 25430719.6.0000.5016), which waived signed informed consent.
Detection of SARS-CoV-2 P.1/VOCs by RT–PCR
A total of 1,626 SARS-CoV-2-positive samples collected between 1 November 2020 and 31 January 2021 (including those 394 with demographic data) were submitted to a real-time RT–PCR screening test designed for the detection of VOCs that use a forward primer (P.1/VOCs-FNF 5′- GGGTGATGCGTATTATGACATGGTTGG), a reverse primer (P.1/VOCs-FNR 5′- CTAGCACCATCATCATACACAGTTCTTGC) and a probe (P.1/VOCs-FNP 5′ FAM (ZEN)- TGGTTGATACTAGTTTGAAGCTAAAA), to detect the ORF1b deletion (NSP6: S106del, G107del, F108del) found in the three VOCs (P.1, B.1.1.7 and B.1.351). Both primers were used at 300 nM and the probe at 150 nM (final concentration), with TaqMan one-step Fast Virus master Mix (ThermoFisher Scientific, no. 4444434). All real-time RT–PCR data collected in this experiment were acquired using the QuantStudio 5 Real-Time PCR System and QuantStudio design & analysis software v.1.4.1 (ThermoFisher Scientific). We previously validated this assay against 185 high-quality, full SARS-CoV-2 genomes, 59 non-P.1 and 126 P.1 (Supplementary Table 7). All oligos used in this study were manufactured by IDT DNA. Because we have not detected the circulation of VOCs B.1.1.7 and B.1.351 in Amazonas state, we use the frequency of NSP6 deletion among real-time RT–PCR positives as a reliable proxy for frequency of the VOC P.1.
SARS-CoV-2 amplification and sequencing
A total of 250 SARS-CoV-2-positive samples (122 male, 128 female; median age 43 years, IQR = 32-46) collected from residents of 25 out of 62 municipalities in Amazonas state, including the capital Manaus, between 16 March and 13 January were subjected to amplification and next-generation sequencing as previously described1, now with a reduced number of amplicons (nine rather than 15) of mean average size ~3,500 bp (ref. 8). Briefly, RNAs were extracted with the Maxwell RSC Viral Total Nucleic Acid Purification Kit (Promega, no. AS1330) and then converted to complementary DNA with Superscript IV reverse transcriptase (ThermoFisher Scientific, no. 18090200). Amplicons were amplified with SuperFi II Green PCR master mix (a proofreading DNA polymerase with >300× Taq fidelity from ThermoFisher Scientific (no. 12369010)), precipitated with PEG 8000 (Promega, no. V3011) and quantified using a fluorimeter. Normalized pooled amplicons of each sample were used to prepare next-generation sequencing libraries with Nextera XT (no. FC-131-1096) and clustered with 500 cycles of MiSeq Reagent Kit v.2 (no. MS-102-2003) on 2× 250 cycles or 2× 150 cycles (no. MS-103-1002) of paired-end runs. All sequencing data were collected using the MiSeq sequencing platform and Miseq Control software v.2.6.2.1 (Illumina).
SARS-CoV-2 whole-genome consensus sequences and genotyping
FASTQ reads were generated by the Illumina pipeline at BaseSpace (https://basespace.illumina.com). All files were downloaded and imported into Geneious v.10.2.6 for trimming and assembly using a customized workflow employing BBDuk and BBMap tools (v.37.25) and the NC_045512.2 RefSeq as a template. Using a threshold of at least 50% to call a base, we generated consensus sequences with mean depth coverage of 2,689× (95% CI of mean 2,376–3,002), with only eight genomes having <1,000× depth coverage. The mean number of mapped reads was 512,967 (95% CI of mean 441,779–584,154), covering at least 98.9% of the RefSeq genome. The final consensus sequences had at least 94% bases with Q score = 30, zero ambiguities and were carefully inspected when a disagreement with RefSeq was observed. Coverage and pairwise identity percentages, as well as the total number of mapped reads (without duplicates) to RefSeq and the percentage of high-quality bases in consensus, were calculated for all consensus files and are shown in Supplementary Table 1. Consensus sequences were initially assigned to viral lineages according to the nomenclature proposed by Rambaut et al.20, using the Pangolin web application (https://pangolin.cog-uk.io) and later confirmed by phylogenetic analyses.
Intrahost SARS-CoV-2 genomic variability
Raw sequencing reads and primer sequences were removed with Trimmomatic v.0.26 (ref. 21) using default parameters. Reads that passed quality filtering were then mapped against the reference genome (NC_045512.2) using the Bowtie2 software v.2.3.5.1 (ref. 22). A.bed file was generated with bedtools v.2.15.0 (ref. 23), SAMtools v.1.10 (ref. 24) and vcftools v.0.1.13 (ref. 25) using the internal parameter vcf-annotated (parameters-filter Qual = 20/MinDP = 100/SnpGap = 20), meaning that only those nucleotide variants supported by reads with mapping quality >20 and at least 100 sequencing coverage depth would be retained in the intermediate variant call file. To characterize the viral intrahost population, we identified all MVs found in the samples—that is, nucleotides highly supported by 10–49% of the reads in a given position and that were not included in the final majority consensus genome. We then replaced the nucleotides supported by the majority of reads by MVs in the consensus genome to evaluate the impact of synonymous and nonsynonymous nucleotide variation between major and minor variants. We performed the synonymous and nonsynonymous analysis using an R pipeline developed for SARS-CoV-2 (ref. 26) with R v.4.0.3 and RStudio v.1.4.1103.
Discrete maximum likelihood and Bayesian phylogeography
All high-quality (<1% N, or non-identified nucleotide) complete (>29 kb) SARS-CoV-2 genomes of lineages B.1.1.28 (n = 512) and B.1.1.33 (n = 595) sampled in Brazil, and of lineage B.1.195 sampled worldwide (n = 110), that were available on GISAID (https://www.gisaid.org/) as of 13 January 2021, were downloaded. SARS-CoV-2 complete genome sequences were aligned using MAFFT v.7.475 (ref. 27). The B.1.1.28 and B.1.1.33 datasets were subjected to maximum likelihood phylogenetic analysis using IQ-TREE v.2.1.2 (ref. 28) under a general time-reversible (GTR) model of nucleotide substitution with a gamma-distributed rate variation among sites and four rate categories (G4), a proportion of invariable sites (+I) and empirical base frequencies (+F), as selected by the ModelFinder application29,30. Branch support was assessed by the approximate likelihood-ratio test based on the Shimodaira–Hasegawa-like procedure with 1,000 replicates. Time-scaled phylogeographic maximum likelihood phylogenetic trees of Brazilian B.1.1.28 and B.1.1.33 datasets were reconstructed using Treetime v.0.8.1 (ref. 31), with a fixed substitution rate (8 × 10⁻⁴ substitutions per site per year) coupled with an ancestral character reconstruction of epidemic locations using PASTML v.1.9.15 (ref. 32) with marginal posterior probabilities approximation and an F81-like model. A time-scaled Bayesian phylogeographic analysis was performed for B.1.195 sampled worldwide using the Bayesian Markov chain Monte Carlo (MCMC) approach, implemented in BEAST v.1.10.4 (ref. 33) with BEAGLE library v.3 (ref. 34), to improve computational time. The Bayesian tree was reconstructed using the GTR + F + I + G4 nucleotide substitution model, the nonparametric Bayesian skyline model as the coalescent tree prior35, a strict molecular clock model with a uniform substitution rate prior (8–10 × 10-4 substitutions per site per year) and a reversible discrete phylogeographic model36 with a continuous-time Markov chain (CTMC) rate reference prior37. Additionally, the nine-nucleotide deletion at nsp1 (delta 640–648: K141, S142, F143) characteristic of the 195-AM clade was incorporated as an informative trait in phylogenetic reconstruction, and transitions were modeled with a symmetric CTMC rate prior. Three MCMC chains were run for 100 million generations and then combined to ensure stationarity and good mixing. Convergence (effective sample size >200) in parameter estimates was assessed using TRACER v.1.7 (ref. 38). The maximum clade credibility (MCC) tree was summarized with TreeAnnotator v.1.10. Maximum likelihood and MCC trees were visualized using FigTree v.1.4.4 (http://tree.bio.ed.ac.uk/software/figtree/).
Continuous Bayesian phylogeography
The phylogenetic diffusion of SARS-CoV-2 clades from Amazonas state identified by the maximum likelihood analysis (195-AM, 28-AM-I and 28-AM-II) was estimated with the heterogeneous relaxed random walk model and a Cauchy distribution39, previously applied to SARS-CoV-2 in Brazil40, using BEAST v.1.10.4 (ref. 33) as explained above. We used strict and local molecular clock models41,42 with a uniform substitution rate prior (8–10 × 10–4 substitutions per site per year) to estimate evolutionary rates. Viral spatial–temporal diffusion was analyzed and visualized in SPREAD v.1.0.7 (ref. 43), and further projected in maps generated with QGIS v.3.10.2 software (http://qgis.org) using public access data downloaded from the GADM v.3.6 database (https://gadm.org). For each lineage and molecular clock model, one MCMC chain was run for 150 million generations and stationarity and mixing were checked as explained above.
Data for social distancing trends
The social distancing trends were obtained from a commercial company (http://inloco.com.br). Inloco’s isolation index analyzes people’s movements for different levels, states, cities and microregions inferred from proprietary technology. Thus, the higher the index the greater the degree of isolation estimated from the site. This index has been used by several Brazilian states’ decision-making authorities since the beginning of the pandemic.
Estimation of Re
To estimate the Re of the Amazonian SARS-CoV-2 clades over time we used the BDSKY model44 implemented within BEAST 2 v.2.6.2 (ref. 45). The sampling rate (d) was set to zero for the period before the oldest sample and then estimated from the data. The BDSKY prior settings were as follows: become uninfectious rate (exponential, mean = 36); reproductive number (log normal, mean = 0.8, s.d. = 0.5); sampling proportion (beta, alpha = 1, beta = 100). Origin parameter was conditioned to root height, and Re was estimated in a piecewise manner over six time intervals (monthly) to the 195-AM clade, five time intervals (bimonthly) to the 28-AM-I clade and two equal time intervals to the P.1 clade. Time intervals were defined from the date of the most recent sample up to the root of the tree. The molecular clock and substitution model were as in the phylogeographic analysis. One MCMC chain was run for 20 million generations and then checked for stationarity and mixing, as explained above.
Statistical analysis
Descriptive statistics, testing for normal distribution (D’Agostino and Pearson and Anderson–Darling) and the nonparametric Mann–Whitney test were used to compare the Ct of SARS-CoV-2 RT–PCR-positive samples from the URT of patients infected with P.1 versus non-P.1 viruses. To avoid bias, only Ct values from samples analyzed by the same RNA extraction method (Promega Maxwell) and the same real-time RT–PCR diagnostic assay (for example, the CDC assay) were compared. The threshold for statistical significance was set to P < 0.05 using two-sided tests. Graphics and statistical analyses were performed using GraphPad v.9.01 and v.9.02 (Prism Software).
Reporting Summary
Further information on research design is available in the Nature Research Reporting Summary linked to this article.
Data availability
All SARS-CoV-2 genomes generated and analyzed in this study are available at the EpiCoV database in GISAID (https://www.gisaid.org) under IDs EPI_ISL_792560, EPI_ISL_801386–801403, EPI_ISL_811148, EPI_ISL_811149, EPI_ISL_833131–833140, EPI_ISL_1034304–1034306, EPI_ISL_1068078–1068292 and EPI_ISL_1661250–1661252. Figures 1a and 5b were created with data provided by http://info.gripe.fiocruz.br, SEMULSP-Manaus and FVS-AM. Administrative areas presented in Fig. 4 were provided by the GADM v.3.6 database (http://gadm.org). Detailed results of MV detection are available at GitHub (https://github.com/dezordi/mFinder/tree/naveca_et_al_2021/supplementary_data). Source data are provided with this paper.
Code availability
We have made available all scripts used for MV detection (https://github.com/dezordi/mFinder) and BEAST XML files (https://github.com/dezordi/mFinder/tree/naveca_et_al_2021/phylo_files) in GitHub folders.
References
Nascimento, V. A. D. et al. Genomic and phylogenetic characterisation of an imported case of SARS-CoV-2 in Amazonas State, Brazil. Mem. Inst. Oswaldo Cruz 115, e200310 (2020).
Fundação em Vigilância e Saúde do Amazonas. Boletim diários dos casos de COVID-19. https://www.fvs.am.gov.br/media/publicacao/21_02_21_BOLETIM_DIÁRIO_DE_CASOS_COVID-19.pdf (2021).
Fujino, T. et al. Novel SARS-CoV-2 variant identified in travelers from Brazil to Japan. Emerg. Infect. Dis. https://doi.org/10.3201/eid2704.210138 (2021).
Faria, N. R. et al. Genomics and epidemiology of the P.1 SARS-CoV-2 lineage in Manaus, Brazil. Science https://doi.org/10.1126/science.abh2644 (2021).
Sabino, E. C. et al. Resurgence of COVID-19 in Manaus, Brazil, despite high seroprevalence. Lancet 397, 452–455 (2021).
Dejnirattisai W. et al. Antibody evasion by the P.1 strain of SARS-CoV-2. Cell https://doi.org/10.1016/j.cell.2021.03.055 (2021).
Buss, L. F. et al. Three-quarters attack rate of SARS-CoV-2 in the Brazilian Amazon during a largely unmitigated epidemic. Science 371, 288–292 (2021).
Naveca, F. et al. Three SARS-CoV-2 reinfection cases by the new Variant of Concern (VOC) P.1/501Y.V3. Preprint at Res. Sq. https://doi.org/10.21203/rs.3.rs-318392/v1 (2021).
Coutinho, R. M. et al. Model-based estimation of transmissibility and reinfection of SARS-CoV-2 P.1 variant. Preprint at medRxiv https://doi.org/10.1101/2021.03.03.21252706 (2021).
Mellan, T. A. et al. Subnational analysis of the COVID-19 epidemic in Brazil. Preprint at medRxiv https://doi.org/10.1101/2020.05.09.20096701 (2020).
He, D., Artzy-Randrup, Y., Musa, S. S. & Stone, L. The unexpected dynamics of COVID-19 in Manaus, Brazil: was herd immunity achieved? Preprint at medRxiv https://doi.org/10.1101/2021.02.18.21251809 (2021).
Hoffmann, M. et al. SARS-CoV-2 variants B.1.351 and P.1 escape from neutralizing antibodies. Cell https://doi.org/10.1016/j.cell.2021.03.036 (2021).
Garcia-Beltran, W. F. et al. Multiple SARS-CoV-2 variants escape neutralization by vaccine-induced humoral immunity. Cell https://doi.org/10.1016/j.cell.2021.03.013 (2021).
Wang, P. et al. Increased resistance of SARS-CoV-2 variant P.1 to antibody neutralization. Cell Host Microbe https://doi.org/10.1016/j.chom.2021.04.007 (2021).
Martin, D. P. et al. The emergence and ongoing convergent evolution of the N501Y lineages coincides with a major global shift in the SARS-CoV-2 selective landscape. Preprint at medRxiv https://doi.org/10.1101/2021.02.23.21252268 (2021).
McCormick, K. D., Jacobs, J. L. & Mellors, J. W. The emerging plasticity of SARS-CoV-2. Science 371, 1306–1308 (2021).
Resende, P. C. et al. The ongoing evolution of variants of concern and interest of SARS-CoV-2 in Brazil revealed by convergent indels in the amino (N)-terminal domain of the Spike protein. Preprint at medRxiv https://doi.org/10.1101/2021.03.19.21253946 (2021).
Tegally, H. et al. Detection of a SARS-CoV-2 variant of concern in South Africa. Nature https://doi.org/10.1038/s41586-021-03402-9 (2021).
Kissler, S. M. et al. Densely sampled viral trajectories suggest longer duration of acute infection with B.1.1.7 variant relative to non-B.1.1.7 SARS-CoV-2. Preprint at medRxiv https://doi.org/10.1101/2021.02.16.21251535 (2021).
Rambaut, A. et al. A dynamic nomenclature proposal for SARS-CoV-2 lineages to assist genomic epidemiology. Nat. Microbiol. https://doi.org/10.1038/s41564-020-0770-5 (2020).
Bolger, A. M., Lohse, M. & Usadel, B. Trimmomatic: a flexible trimmer for Illumina sequence data. Bioinformatics 30, 2114–2120 (2014).
Langmead, B. & Salzberg, S. L. Fast gapped-read alignment with Bowtie 2. Nat. Methods 9, 357–359 (2012).
Quinlan, A. R. BEDTools: the Swiss-Army tool for genome feature analysis. Curr. Protoc. Bioinformatics 47, 11.12.1–34 (2014).
Li, H. et al. The Sequence Alignment/Map format and SAMtools. Bioinformatics 25, 2078–2079 (2009).
Danecek, P. et al. The variant call format and VCFtools. Bioinformatics 27, 2156–2158 (2011).
Mercatelli, D. & Giorgi, F. M. Geographic and genomic distribution of SARS-CoV-2 mutations. Front. Microbiol. 11, 1800 (2020).
Katoh, K. & Standley, D. M. MAFFT multiple sequence alignment software version 7: improvements in performance and usability. Mol. Biol. Evol. 30, 772–780 (2013).
Nguyen, L. T., Schmidt, H. A., von Haeseler, A. & Minh, B. Q. IQ-TREE: a fast and effective stochastic algorithm for estimating maximum-likelihood phylogenies. Mol. Biol. Evol. 32, 268–274 (2015).
Tavaré, S. Some probabilistic and statistical problems in the analysis of DNA sequences. Lectures on Mathematics in the Life Sciences https://www.damtp.cam.ac.uk/user/st321/CV_&_Publications_files/STpapers-pdf/T86.pdf (1986).
Kalyaanamoorthy, S., Minh, B. Q., Wong, T. K. F., von Haeseler, A. & Jermiin, L. S. ModelFinder: fast model selection for accurate phylogenetic estimates. Nat. Methods 14, 587–589 (2017).
Sagulenko, P., Puller, V. & Neher, R. A. TreeTime: maximum-likelihood phylodynamic analysis. Virus Evol. https://doi.org/10.1093/ve/vex042 (2018).
Ishikawa, S. A., Zhukova, A., Iwasaki, W. & Gascuel, O. A fast likelihood method to reconstruct and visualize ancestral scenarios. Mol. Biol. Evol. 36, 2069–2085 (2019).
Suchard, M. A. et al. Bayesian phylogenetic and phylodynamic data integration using BEAST 1.10. Virus Evol. 4, vey016 (2018).
Suchard, M. A. & Rambaut, A. Many-core algorithms for statistical phylogenetics. Bioinformatics 25, 1370–1376 (2009).
Drummond, A. J., Rambaut, A., Shapiro, B. & Pybus, O. G. Bayesian coalescent inference of past population dynamics from molecular sequences. Mol. Biol. Evol. 22, 1185–1192 (2005).
Lemey, P., Rambaut, A., Drummond, A. J. & Suchard, M. A. Bayesian phylogeography finds its roots. PLoS Comput. Biol. 5, e1000520 (2009).
Ferreira, M. A. R. & Suchard, M. A. Bayesian analysis of elapsed times in continuous‐time Markov chains. Can. J. Stat. 36, 355–368 (2008).
Rambaut, A., Drummond, A. J., Xie, D., Baele, G. & Suchard, M. A. Posterior summarisation in Bayesian phylogenetics using Tracer 1.7. Syst. Biol. https://doi.org/10.1093/sysbio/syy032 (2018).
Lemey, P., Rambaut, A., Welch, J. J. & Suchard, M. A. Phylogeography takes a relaxed random walk in continuous space and time. Mol. Biol. Evol. 27, 1877–1885 (2010).
Candido, D. S. et al. Evolution and epidemic spread of SARS-CoV-2 in Brazil. Science 369, 1255–1260 (2020).
Drummond, A. J. & Suchard, M. A. Bayesian random local clocks, or one rate to rule them all. BMC Biol. 8, 114 (2010).
Yoder, A. D. & Yang, Z. Estimation of primate speciation dates using local molecular clocks. Mol. Biol. Evol. 17, 1081–1090 (2000).
Bielejec, F., Rambaut, A., Suchard, M. A. & Lemey, P. SPREAD: spatial phylogenetic reconstruction of evolutionary dynamics. Bioinformatics 27, 2910–2912 (2011).
Stadler, T., Kuhnert, D., Bonhoeffer, S. & Drummond, A. J. Birth–death skyline plot reveals temporal changes of epidemic spread in HIV and hepatitis C virus (HCV). Proc. Natl Acad. Sci. USA 110, 228–233 (2013).
Bouckaert, R. et al. BEAST 2.5: an advanced software platform for Bayesian evolutionary analysis. PLoS Comput. Biol. 15, e1006650 (2019).
Acknowledgements
We thank all the health care workers and scientists who have worked hard to deal with this pandemic threat, the GISAID team and all the EpiCoV database submitters—in particular, the Japanese National Institute of Infectious Diseases members T. Sekizuka, K. Itokawa, R. Tanaka and M. Hashino—for publication of genomes. A GISAID acknowledgment table containing sequences used in this study is shown in Supplementary Table 8. We also thank N. Faria for sharing unpublished findings regarding the SARS-CoV-2 B.1.1.28 lineage. We also appreciate the support of Genomic Coronavirus Fiocruz Network members and the Respiratory Viruses Genomic Surveillance Network of the General Laboratory Coordination of the Brazilian Ministry of Health, Brazilian Central Laboratory States and the Amazonas surveillance teams for their partnership in viral surveillance in Brazil. Funding support is acknowledged from Fundação de Amparo à Pesquisa do Estado do Amazonas – FAPEAM (PCTI-EmergeSaude/AM call 005/2020 and Rede Genômica de Vigilância em Saúde), Conselho Nacional de Desenvolvimento Científico e Tecnológico – CNPq (grant no. 403276/2020-9) and Inova Fiocruz/Fundação Oswaldo Cruz (grant no. VPPCB-007-FIO-18-2-30—Geração de conhecimento), received by F.G.N., and Fundação de Amparo à Pesquisa do Estado do Rio de Janeiro – FAPERJ (grant no. E-26/202.896/2018), received by G.B. F.G.N. and G.B. are also supported by CNPq through their productivity research fellowships (306146/2017-7 and 302317/2017-1, respectively). In loving memory of F. R. Naveca, C. R. dos Santos, V. L. Costa de Souza and all the relatives and colleagues we have lost to COVID-19.
Author information
Authors and Affiliations
Contributions
F.G.N. contributed to writing of the report, data analysis, laboratory management and obtaining financial support. V.N., V.C.d.S., A.d.L.C., F.N., G.S., A.C., D.D., K.P., M.M., M.J.B., M.J. and L.G. contributed to diagnostics and sequencing analysis. C.F.d.C., V.S., D.B., M.S., T.M., G.P., L.A. and J.H.S. contributed to patient and public health surveillance data. I.A. and F.Z.D. contributed to formal data analysis of sequence diversity. M.M.S., G.L.W., P.C.R., E.D., T.G. and G.B. contributed to formal data analysis and writing and editing of the report.
Corresponding authors
Ethics declarations
Competing interests
The authors declare no competing interests.
Additional information
Peer review information Nature Medicine thanks Richard Neher, Xiang Ji and the other, anonymous, reviewer(s) for their contribution to the peer review of this work. Alison Farrell was the primary editor on this article and managed its editorial process and peer review in collaboration with the rest of the editorial team.
Publisher’s note Springer Nature remains neutral with regard to jurisdictional claims in published maps and institutional affiliations.
Extended data
Extended Data Fig. 1 Maximum Likelihood (ML) phylogeographic analysis.
ML phylogeographic analysis of lineages B.1.1.28/P.2 (n = 674) (a) and B.1.1.33 (n = 602) (b) in Brazil. Ancestral character state reconstruction was done in PastML with time-scaled trees. Importation and exportation events deduced from location state changes toward (n = 28) and from (n = 2) the Amazon state are detailed. The singleton Amazonian sequences and the MRCA of Amazonian clusters are indicated by black outlined circular shapes. Shaded boxes indicate the Amazonian clusters and the sub-clades that define lineages P.1 and P.2. The origin or destination of the event is indicated alongside the estimated date (Amazonian clusters) or sampling date (singletons). All locations are colored according to the legend in the bottom right.
Extended Data Fig. 2 Minor variants density representation.
Violin plot showing the density of samples with varying degrees of minor variants in two different sampling periods (reddish March-September 2020 - n = 67 biologically independent samples and blueish October 2020 to January 2021 - n = 60 biologically independent samples). Data are presented as mean values (white dots into violin plots) +/- standard deviation (SD based on values between first and third quartile, black boxplot) and adjacent values (Upper and Lower) present with vertical black lines.
Supplementary information
Supplementary Information
Supplementary Tables 1–7 and Note.
Supplementary Table 8
GISAID acknowledgements.
Source data
Source Data Fig. 6
Statistical source data used for Ct viral load comparison
Rights and permissions
About this article

Cite this article
Naveca, F.G., Nascimento, V., de Souza, V.C. et al. COVID-19 in Amazonas, Brazil, was driven by the persistence of endemic lineages and P.1 emergence. Nat Med 27, 1230–1238 (2021). https://doi.org/10.1038/s41591-021-01378-7
Received:
Accepted:
Published:
Issue Date:
DOI: https://doi.org/10.1038/s41591-021-01378-7
This article is cited by
-
Low handgrip strength is associated with worse functional outcomes in long COVID
Scientific Reports (2024)
-
Dispersion patterns of SARS-CoV-2 variants Gamma, Lambda and Mu in Latin America and the Caribbean
Nature Communications (2024)
-
Long-term monitoring of COVID-19 prevalence in raw and treated wastewater in Salvador, the largest capital of the Brazilian Northeast
Scientific Reports (2023)
-
Blood leukocyte transcriptional modules and differentially expressed genes associated with disease severity and age in COVID-19 patients
Scientific Reports (2023)
-
Preterm births prevalence during the COVID-19 pandemic in Brazil: results from the national database
Scientific Reports (2023)
