
Abstract
Although mass spectrometry is well suited to identifying thousands of potential protein post-translational modifications (PTMs), it has historically been biased towards just a few. To measure the entire set of PTMs across diverse proteomes, software must overcome the dual challenges of covering enormous search spaces and distinguishing correct from incorrect spectrum interpretations. Here, we describe TagGraph, a computational tool that overcomes both challenges with an unrestricted string-based search method that is as much as 350-fold faster than existing approaches, and a probabilistic validation model that we optimized for PTM assignments. We applied TagGraph to a published human proteomic dataset of 25 million mass spectra and tripled confident spectrum identifications compared to its original analysis. We identified thousands of modification types on almost 1 million sites in the proteome. We show alternative contexts for highly abundant yet understudied PTMs such as proline hydroxylation, and its unexpected association with cancer mutations. By enabling broad characterization of PTMs, TagGraph informs as to how their functions and regulation intersect.
This is a preview of subscription content, access via your institution
Access options
Access Nature and 54 other Nature Portfolio journals
Get Nature+, our best-value online-access subscription
$29.99 / 30 days
cancel any time
Subscribe to this journal
Receive 12 print issues and online access
$209.00 per year
only $17.42 per issue
Buy this article
- Purchase on Springer Link
- Instant access to full article PDF
Prices may be subject to local taxes which are calculated during checkout


Code availability
The TagGraph algorithm and supporting software can be downloaded via http://sourceforge.net/projects/taggraph. TagGraph was developed under Python v.2.7 and makes use of freely available packages including lxml v.4.2.4, mysqlclient v.1.3.13, networkX v.1.1171, NumPy v.1.10.0, Pympler v.0.6, pymzml v.0.7.8, Pyteomics v.3.5.172, SQLAlchemy v.1.2.11 and SciPy v.1.2.0.
Data availability
Raw and processed data from the A375 cell line (Figs. 1 and 2) are available from the PRIDE repository61 (No. PXD005912). Search results from the phosphorylation-enriched dataset (Supplementary Fig. 7) are available from PRIDE (No. PXD008899). TagGraph search results from the Human Proteome dataset24 (Figs. 3–5) are available from the MassIVE repository73 with the original accession (No. MSV000079514). TagGraph search results from the lung-specific, low-resolution dataset (Supplementary Fig. 10) are available from PRIDE (No. PXD008902). Dataset files are available from https://taggraph.page.link/Datasets, from the above-mentioned data repositories or directly from the corresponding author.
References
Eisenhaber, B. & Eisenhaber, F. Posttranslational modifications and subcellular localization signals: indicators of sequence regions without inherent 3D structure? Curr. Protein Pept. Sci. 8, 197–203 (2007).
Nussinov, R., Tsai, C.-J., Xin, F. & Radivojac, P. Allosteric post-translational modification codes. Trends Biochem. Sci. 37, 447–455 (2012).
Creasy, D. M. & Cottrell, J. S. Unimod: protein modifications for mass spectrometry. Proteomics 4, 1534–1536 (2004).
Zhao, Y. & Jensen, O. N. Modification-specific proteomics: strategies for characterization of post-translational modifications using enrichment techniques. Proteomics 9, 4632–4641 (2009).
Prabakaran, S., Lippens, G., Steen, H. & Gunawardena, J. Post-translational modification: nature’s escape from genetic imprisonment and the basis for dynamic information encoding. Wiley Interdiscip. Rev. Syst. Biol. Med. 4, 565–583 (2012).
Skinner, O. S. & Kelleher, N. L. Illuminating the dark matter of shotgun proteomics. Nat. Biotechnol. 33, 717–718 (2015).
Na, S. & Paek, E. Software eyes for protein post-translational modifications. Mass Spectrom. Rev. 34, 133–147 (2015).
Gupta, N., Bandeira, N., Keich, U. & Pevzner, P. A. Target-decoy approach and false discovery rate: when things may go wrong. J. Am. Soc. Mass Spectrom. 22, 1111–1120 (2011).
Devabhaktuni, A. & Elias, J. E. Application of de novo sequencing to large-scale complex proteomics datasets. J. Proteome Res. 15, 732–742 (2016).
Ferragina, P. & Manzini, G. Opportunistic data structures with applications. In Proc. 41st Annual Symposium on Foundations of Computer Science 390–398, https://doi.org/10.1109/SFCS.2000.892127 (IEEE Computer Society, 2000).
Elias, J. E. & Gygi, S. P. Target-decoy search strategy for increased confidence in large-scale protein identifications by mass spectrometry. Nat. Methods 4, 207–214 (2007).
Na, S., Bandeira, N. & Paek, E. Fast multi-blind modification search through tandem mass spectrometry. Mol. Cell. Proteomics 11, M111.010199 (2012).
Bern, M., Kil, Y. J. & Becker, C. Byonic: advanced peptide and protein identification software. Curr. Protoc. Bioinformatics 40, 13.20.1–13.20.14 (2012).
Chick, J. M. et al. A mass-tolerant database search identifies a large proportion of unassigned spectra in shotgun proteomics as modified peptides. Nat. Biotechnol. 33, 743–749 (2015).
Kong, A. T., Leprevost, F. V., Avtonomov, D. M., Mellacheruvu, D. & Nesvizhskii, A. I. MSFragger: ultrafast and comprehensive peptide identification in mass spectrometry-based proteomics. Nat. Methods 14, 513–520 (2017).
Griss, J. et al. Recognizing millions of consistently unidentified spectra across hundreds of shotgun proteomics datasets. Nat. Methods 13, 651–656 (2016).
Han, X., He, L., Xin, L., Shan, B. & Ma, B. PeaksPTM: mass spectrometry-based identification of peptides with unspecified modifications. J. Proteome Res. 10, 2930–2936 (2011).
Nesvizhskii, A. I., Vitek, O. & Aebersold, R. Analysis and validation of proteomic data generated by tandem mass spectrometry. Nat. Methods 4, 787–797 (2007).
Fu, Y. & Qian, X. Transferred subgroup false discovery rate for rare post-translational modifications detected by mass spectrometry. Mol. Cell. Proteomics 13, 1359–1368 (2014).
Keller, A., Nesvizhskii, A. I., Kolker, E. & Aebersold, R. Empirical statistical model to estimate the accuracy of peptide identifications made by MS/MS and database search. Anal. Chem. 74, 5383–5392 (2002).
Huttlin, E. L. et al. A tissue-specific atlas of mouse protein phosphorylation and expression. Cell 143, 1174–1189 (2010).
Sharma, K. et al. Ultradeep human phosphoproteome reveals a distinct regulatory nature of Tyr and Ser/Thr-based signaling. Cell Rep. 8, 1583–1594 (2014).
Beausoleil, S. A., Villén, J., Gerber, S. A., Rush, J. & Gygi, S. P. A probability-based approach for high-throughput protein phosphorylation analysis and site localization. Nat. Biotechnol. 24, 1285–1292 (2006).
Kim, M.-S. et al. A draft map of the human proteome. Nature 509, 575–581 (2014).
Creasy, D. M. & Cottrell, J. S. Error tolerant searching of uninterpreted tandem mass spectrometry data. Proteomics 2, 1426–1434 (2002).
Savitski, M. M., Nielsen, M. L. & Zubarev, R. A. ModifiComb, a new proteomic tool for mapping substoichiometric post-translational modifications, finding novel types of modifications, and fingerprinting complex protein mixtures. Mol. Cell. Proteomics 5, 935–948 (2006).
Jenuwein, T. & Allis, C. D. Translating the histone code. Science 293, 1074–1080 (2001).
Thandapani, P., O’Connor, T. R., Bailey, T. L. & Richard, S. Defining the RGG/RG Motif. Mol. Cell 50, 613–623 (2013).
Fisher, D., Krasinska, L., Coudreuse, D. & Novák, B. Phosphorylation network dynamics in the control of cell cycle transitions. J. Cell. Sci. 125, 4703–4711 (2012).
Guo, A. et al. Immunoaffinity enrichment and mass spectrometry analysis of protein methylation. Mol. Cell. Proteomics 13, 372–387 (2014).
Olsen, J. V. et al. Quantitative phosphoproteomics reveals widespread full phosphorylation site occupancy during mitosis. Sci. Signal. 3, ra3 (2010).
Wu, R. et al. A large-scale method to measure absolute protein phosphorylation stoichiometries. Nat. Methods 8, 677–683 (2011).
Starheim, K. K., Gevaert, K. & Arnesen, T. Protein N-terminal acetyltransferases: when the start matters. Trends Biochem. Sci. 37, 152–161 (2012).
Grunstein, M. Histone acetylation in chromatin structure and transcription. Nature 389, 349–352 (1997).
Weinert, B. T. et al. Acetylation dynamics and stoichiometry in Saccharomyces cerevisiae. Mol. Syst. Biol. 10, 716 (2014).
Wagner, G. & Hirschey, M. D. Nonenzymatic protein acylation as a carbon stress regulated by sirtuin deacylases. Mol. Cell 54, 5–16 (2014).
Garcia, Ba, Pesavento, J. J., Mizzen, C. A. & Kelleher, N. L. Pervasive combinatorial modification of histone H3 in human cells. Nat. Methods 4, 487–489 (2007).
Xie, Z. et al. Lysine succinylation and lysine malonylation in histones. Mol. Cell. Proteomics 11, 100–107 (2012).
Huang, H., Sabari, B. R., Garcia, B. A., David Allis, C. & Zhao, Y. SnapShot: histone modifications. Cell 159, 458 (2014).
Shoulders, M. D. & Raines, R. T. Collagen structure and stability. Annu. Rev. Biochem. 78, 929–958 (2009).
The UniProt Consortium. UniProt: a hub for protein information. Nucleic Acids Res. 43, D204–D212 (2014).
Neuman, R. E. & Logan, M. A. The determination of hydroxyproline. J. Biol. Chem. 184, 299–306 (1950).
Fietzek, P. P., Kuhn, K. & Furthmayr, H. Comparative sequence studies on alpha2-CB2 from calf, human, rabbit and pig-skin collagen. Eur. J. Biochem. 47, 257–261 (1974).
Reimand, J., Wagih, O. & Bader, G. D. The mutational landscape of phosphorylation signaling in cancer. Sci. Rep. 3, 2651 (2013).
Forbes, S. A. et al. COSMIC: exploring the world’s knowledge of somatic mutations in human cancer. Nucleic Acids Res. 43, D805–D811 (2015).
Yang, M. et al. Asparagine and aspartate hydroxylation of the cytoskeletal ankyrin family is catalyzed by factor-inhibiting hypoxia-inducible factor. J. Biol. Chem. 286, 7648–7660 (2011).
Ma, B. Novor: real-time peptide de novo sequencing software. J. Am. Soc. Mass Spectrom. 26, 1885–1894 (2015).
Fermin, D., Walmsley, S. J., Gingras, A.-C., Choi, H. & Nesvizhskii, A. I. LuciPHOr: algorithm for phosphorylation site localization with false localization rate estimation using modified target-decoy approach. Mol. Cell. Proteomics 12, 3409–3419 (2013).
Meier, F. et al. Online parallel accumulation—serial fragmentation (PASEF) with a novel trapped ion mobility mass spectrometer. Mol. Cell. Proteomics 17 , 2534–2545 (2018).
Gonzalez, C. G., Zhang, L. & Elias, J. E. From mystery to mechanism: can proteomics build systems-level understanding of our gut microbes? Expert. Rev. Proteomics 14, 473–476 (2017).
Ingolia, N. T., Ghaemmaghami, S., Newman, J. R. S. & Weissman, J. S. Genome-wide analysis in vivo of translation with nucleotide resolution using ribosome profiling. Science 324, 218–223 (2009).
Woo, S. et al. Proteogenomic database construction driven from large scale RNA-seq data. J. Proteome Res. 13, 21–28 (2014).
Serang, O. & Noble, W. A review of statistical methods for protein identification using tandem mass spectrometry. Stat. Interface 5, 3–20 (2012).
Ma, B. et al. PEAKS: powerful software for peptide de novo sequencing by tandem mass spectrometry. Rapid Commun. Mass Spectrom. 17, 2337–2342 (2003).
Chi, H. et al. pNovo: de novo peptide sequencing and identification using HCD spectra. J. Proteome Res. 9, 2713–2724 (2010).
Frank, A. & Pevzner, P. PepNovo: de novo peptide sequencing via probabilistic network modeling. Anal. Chem. 77, 964–973 (2005).
Crooks, G. E., Hon, G., Chandonia, J.-M. & Brenner, S. E. WebLogo: a sequence logo generator. Genome Res. 14, 1188–1190 (2004).
Huang, D. W., Sherman, B. T. & Lempicki, R. A. Systematic and integrative analysis of large gene lists using DAVID bioinformatics resources. Nat. Protoc. 4, 44–57 (2009).
Fok, J. Y., Ekmekcioglu, S. & Mehta, K. Implications of tissue transglutaminase expression in malignant melanoma. Mol. Cancer Ther. 5, 1493–1503 (2006).
Yang, F., Shen, Y., Camp, D. G. & Smith, R. D. High-pH reversed-phase chromatography with fraction concatenation for 2D proteomic analysis. Expert Rev. Proteomics 9, 129–134 (2012).
Vizcaíno, J. A. et al. A guide to the Proteomics Identifications Database proteomics data repository. Proteomics 9, 4276–4283 (2009).
Wilhelm, M. et al. Mass-spectrometry-based draft of the human proteome. Nature 509, 582–587 (2014).
Eng, J. K., McCormack, A. L. & Yates, J. R. An approach to correlate tandem mass spectral data of peptides with amino acid sequences in a protein database. J. Am. Soc. Mass Spectrom. 5, 976–989 (1994).
O’Donovan, C. et al. High-quality protein knowledge resource: SWISS-PROT and TrEMBL. Brief. Bioinform. 3, 275–284 (2002).
Deutsch, E. mzML: a single, unifying data format for mass spectrometer output. Proteomics 8, 2776–2777 (2008).
Kim, S., Gupta, N. & Pevzner, P. A. Spectral probabilities and generating functions of tandem mass spectra: a strike against decoy databases. J. Proteome Res. 7, 3354–3363 (2008).
Nesvizhskii, A. I. A survey of computational methods and error rate estimation procedures for peptide and protein identification in shotgun proteomics. J. Proteomics 73, 2092–2123 (2010).
Zhang, Y., Wen, Z., Washburn, M. P. & Florens, L. Refinements to label free proteome quantitation: how to deal with peptides shared by multiple proteins. Anal. Chem. 82, 2272–2281 (2010).
Choi, H., Fermin, D. & Nesvizhskii, A. I. Significance analysis of spectral count data in label-free shotgun proteomics. Mol. Cell. Proteomics 7, 2373–2385 (2008).
Uhlén, M. et al. Tissue-based map of the human proteome. Science 347, 1260419 (2015).
Hagberg, A. A., Schult, D. A. & Swart, P. J. Exploring network structure, dynamics, and function using NetworkX. In Proc. 7th Python in Science Conference (SciPy) (2008); https://doi.org/10.1016/j.jelectrocard.2010.09.003
Goloborodko, A. A., Levitsky, L. I., Ivanov, M. V. & Gorshkov, M. V. Pyteomics—a python framework for exploratory data analysis and rapid software prototyping in proteomics. J. Am. Soc. Mass Spectrom. 24, 301–304 (2013).
Wang, M. et al. Assembling the community-scale discoverable human proteome. Cell Syst. 7, 412–421 (2018).
Acknowledgements
This work was supported by a Damon Runyon-Rachleff Innovation Award from the Damon Runyon Cancer Research Foundation (No. DRR-13-11 to J.E.E.), the W.M. Keck Foundation Medical Research Program (J.E.E.), the Bill and Melinda Gates Foundation (No. OPP1113682 to J.E.E.), the National Cancer Institute (No. U01 CA194389 to J.E.E.), the National Institute of Dental and Craniofacial Research (No. R01DE027750 to J.E.E.), the Stanford Graduate Fund (A.D.), the Wallenberg Foundation (N.O.), the National Science Foundation Graduate Research Fellowship (C.G.) and the Howard Hughes Medical Institute Gilliam Fellowship for Advanced Study (C.G.). We thank P. Khavari for supplying A375 cells and D. Bai (UVA) for use of her fragmentation calculation software. We acknowledge members of the Elias Lab, as well as D. Dill, P. Mallick, T. Meyer, D. Mochley-Rosen and J. Wysocka, for helpful discussions.
Author information
Authors and Affiliations
Contributions
A.D. designed and implemented all algorithms, designed and carried out all A375 mass spectrometry experiments, performed human proteome analyses and wrote the manuscript. J.E.E. designed algorithms, compiled data, performed analyses, designed figures and wrote the manuscript. S.L. compiled data and improved the software. L.Z. validated spectrum assignments. K.S. and C.G. compiled data and generated figures. N.O. performed synthetic peptide–spectra analysis. S.P. and K.R. improved the software.
Corresponding author
Ethics declarations
Competing interests
The authors declare no competing interests.
Additional information
Publisher’s note: Springer Nature remains neutral with regard to jurisdictional claims in published maps and institutional affiliations.
Integrated supplementary information
Supplementary Figure 1 TagGraph algorithm workflow overview.
TagGraph employs a five-step procedure as depicted below, and detailed in Supplementary Note 1: (i) De novo sequences are used to query an FM-indexed sequence database. All candidate database entries containing a maximum-length substring in common with the de novo sequence are retrieved. (ii) The de novo sequence is compared against each database-derived candidate match. Continuous amino acid substrings of length >2 that are identical between the query and database candidate are identified as putative ‘tags’. (iii) Candidate matches (defined as a peptide plus the set of its assigned modifications) are retrieved using a longest path algorithm on a directed acyclic graph. Sequence tags defined in (ii) above are represented as nodes in the graph and modifications as edges. Paths are drawn from start positions on the database peptide to end positions through nodes and edges. (iv) Candidate matches over all database peptides are collected and scored against the MS/MS spectrum using a probabilistic scoring model. For the hypothetical example depicted in (i-iv), the peptide ‘PGSAFRIK’ would be returned as the best match, since it has the greatest similarity with the underlying de novo peptide, database candidate with the longest substring match (that is, 4), and support from the underlying MS/MS spectrum. (v) After all de novo sequences are analyzed from the entire input list, additional candidate modification annotations are created for select spectra if they are likely to be correct based on global dataset modification abundances. Modification candidates are iteratively refined based on their frequencies in the entire dataset under consideration (Supplementary Note 1).
Supplementary Figure 2 Hierarchical Bayes model description.
a) Overview of hierarchical Bayes model with Expectation Maximization fitting. First, attributes (b, below) are assigned to each peptide-spectrum match from the entire dataset. Initial, naïve likelihood parameters are applied noting the likelihood that peptide-spectrum matches are correct or incorrect given each attribute (P(A|+), P(A|-)), respectively. Second, all attributes are combined to estimate the relative likelihood that each peptide-spectrum match is correct given all available data (P(+|D0)). Third, the parameters used to estimate all likelihood models are refined based on the correct (P(D|+)) and incorrect (P(D|-)) distributions learned from the previous iteration. b) Bayes model used for fitting correct (+) and incorrect (-) peptide-spectrum match distributions. Gray arrows indicate dependencies between model attributes and the distribution being trained. Blue arrows indicate dependencies between model attributes. Attributes in magenta ovals specifically pertain to sequence modifications. Further details are provided in Supplementary Note 4. c) Example distributions for several model attributes derived from the A375 dataset (Fig. 1). Likelihood distributions were iteratively refined across multiple measurement dimensions using expectation-maximization (EM).
Supplementary Figure 3 Expectation-maximization-estimated false discovery rate estimates are robust.
a) Randomized starting model guesses for expectation-maximization-based training of the hierarchical Bayes model rapidly converged, and yielded highly consistent probability estimates. b) Five-fold cross-validation demonstrated that training the EM-optimized hierarchical Bayes model did not substantially affect spectrum scores. Each model was trained and tested distinct spectra sets. Pair-wise comparisons between each cross-validation analysis are shown in the matrix as follows: The diagonal represents the overall score distribution (−60 < EM score >60), analogous to Fig. 2a, with the number of confidently assigned spectra (EM score > 2) indicated (green box); the lower left scatter plots compare EM score values for each pair of cross validation sets, noting the correlation (R2) for the entire score range (-60 < EM score >60). No spectra were found with conflicting (that is, positive and negative scores), but some cross validation pairs differed in the very high EM score sub-population (>20). This caused some deviation from perfect correlation (R2 > 90). The range (-20 <EM score >20, yellow box, upper right scatter plots) containing over 94% of confident identifications was markedly closer to unity (R2 >0.99). Further details of the cross-validation procedure can be found in Supplementary Note 4D. c) The A375 dataset was searched against randomized (Markov chain length = 4) protein sequence database as previously described (Elias, J. E. & Gygi, S. P. Target-decoy search strategy for increased confidence in large-scale protein identifications by mass spectrometry. Nat. Methods 4, 207–14 (2007)), and compared with search results generated from the standard human proteome database used in Figs. 1 and 2. The peptide spectrum matches from standard and Markov database searches were divided into two bins: those with EM-estimated probabilities greater than 0.5 (positive EM scores; blue) and those with EM probabilities less than 0.5 (negative EM scores; gray). Three attributes and corresponding thresholds were selected based on the expectation of having little dependence on the type of dataset searched: high spectrum score; long matching substring length; and large modification mass (see Supplementary Note 4B for definitions). Discriminate scores comparing the high and low EM distributions above each indicated threshold (yellow boxes) were calculated (Supplementary Note 4E). Discriminant values above 1 were deemed as strong differences between high-and low-EM distributions; values in green and red are consistent with appropriate and inappropriate search spaces, respectively. d) Discriminant scores derived from the attributes shown in Supplementary Fig. 4b reliably indicate low- and high-confidence analyses across multiple searches, including the A375 dataset searched against the Markov-modeled proteome (word-lengths of 1-4; red), the A375 dataset searched against the standard human proteome (light green), and several arbitrarily selected datasets from the Kim et al. proteome (dark green, from left to right: Adult kidney/bRP/Velos; Adult Kidney/Gel/Elite; Adult Liver/bRP/Elite; Adult Liver bRP/Velos; Adult Monocytes/bRP/Elite; Adult Monocytes/bRP/Velos; Adult Platelets/Gel/Elite; Adult Retina/Gel/Elite; Fetal Brain/bRP/Elite; Fetal Brain/Gel/Velos). e) Despite major model differences between true and randomized database searches, the EM model can still produce high-scoring results from randomized searches (red), which stem from high-quality underlying de novo sequences. Searches against standard databases, however tend to have greater separation between correct and incorrect distributions (green).
Supplementary Figure 4 Conflicting high-confidence peptide-spectrum matches strongly favor TagGraph interpretations over SEQUEST.
a) Of 46,191 MS/MS spectra for which both TagGraph and SEQUEST returned a high-confidence result, 98.36% agreed (left box; identical peptide-spectrum matches (PSMs)), consistent with an estimated 1% FDR for both algorithms. Of the MS/MS spectra which were exclusively identified by TagGraph (right box), 60% bore at least one modification that was not considered in the SEQUEST search parameters. All PSMs were derived from the A375 dataset (Dataset 1). Modification categories were assigned based on Uniprot annotations, and are not mutually exclusive for a given PSM. b) Of the 1.64% of high-confidence PSMs for which SEQUEST and TagGraph disagreed, PSM attributes including missed cleavage sites (top) and algorithm-assigned score (bottom) were more consistent with high-confidence identifications for TagGraph (right) than for SEQUEST (left).
Supplementary Figure 5 Examples of TagGraph-assigned peptide-spectrum matches that conflict with high-confidence SEQUEST assignments.
Representative spectra demonstrating superior fragment ion assignments made by TagGraph for peptides more consistent with LysC digestion than the conflicting peptides SEQUEST assigned to the same spectra. Both results were assigned scores consistent with a 1% FDR on the A375 dataset with respect to each set of search results.
Supplementary Figure 6 Example spectra depicting Case 1 (modification mislocalization) and Case 2 (incorrect peptide sequence) interpretation errors.
Case 1 and 2 errors further defined in Supplementary Note 3.
Supplementary Figure 7 TagGraph returns expected phosphorylated peptides from a phosphorylation-enriched dataset.
We searched 451,655 MS/MS spectra from a previously published dataset of phosphorylation-enriched peptides using SEQUEST, TagGraph, PEAKS-PTM, Open Search (with SEQUEST) and MSFragger methods (see Online Methods). a) Delta-mass histograms analogous to the one shown in Fig. 3c have similar appearances for TagGraph (left), PEAKS-PTM (second), Open Search (third) and MSFragger (right). b) High-confidence TagGraph, PEAKS-PTM, Open Search, and MSFragger results were compared with high-confidence SEQUEST search results. Top row: Venn diagrams note the overlap in spectra for which each search approach yielded a high-confidence search results, as estimated by conventional target-decoy plus Linear Discriminant Analysis (SEQUEST, Open Search), Hierarchical Bayes + EM (TagGraph), an internal target-decoy method (PEAKS-PTM), or EM as implemented by the trans-proteomic pipeline toolkit (MSFragger). No attempt was made to reconcile lower-stringency modification assignments (for example, PEAKS-PTM), as measured in Fig. 2c. Second row: Spectra for which both SEQUEST and the indicated expanded search algorithm returned high-confidence results were identified as non-phosphorylated or phosphorylated peptides. For each comparison, spectra for which expanded search algorithms disagreed in amino acid or modification configuration were 1-3% of all high-confidence, overlapping spectra. Third row: Phosphorylation sites on SEQUEST-identified phosphorylated peptides were localized with the A-score algorithm (Beausoleil, S. A., Villén, J., Gerber, S. A., Rush, J. & Gygi, S. P. A probability-based approach for high-throughput protein phosphorylation analysis and site localization. Nat. Biotechnol. 24, 1285–92 (2006)) with a confidence score threshold of 19. Of the spectra for which the indicated expanded search algorithm agreed with the SEQUEST-produced modification and sequence configurations, roughly half could be localized with A-score. Alternate PTM configurations could not be assessed for Open Search or MSFragger search results. Fourth row: TagGraph and PEAKS-PTM agreed well (95-98%) with search results for which A-score was able to localize phosphorylation to specific amino acids. Open Search and MSFragger do not directly indicate modification locations, and therefore could not be evaluated.
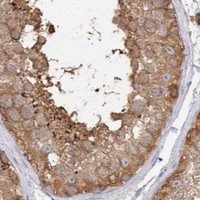
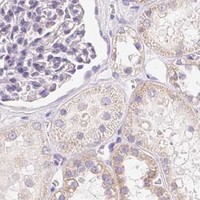
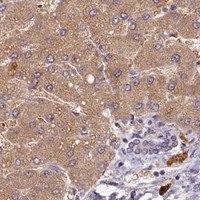
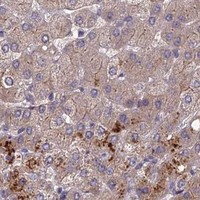
Supplementary Figure 8 Greater proteome coverage by TagGraph relative to Kim et al.
a) The number of proteins identified by TagGraph and not Kim et al. are shown for each tissue examined in this dataset. Identified proteins were assigned one of three categories: (i) proteins with any unmodified tryptic peptides mapped to them, (ii) proteins with unmodified non-tryptic peptides mapped to them and no unmodified tryptic peptides mapped, and (iii) proteins with only modified peptides mapped to them. Proteins were designated as identified in the Kim et al. analysis if at least one peptide was mapped to them, and proteins were designated as present in the TagGraph analysis if their normalized spectral abundance factor (NSAF) was greater than zero. We attribute the pronounced spike protein identifications from the Adult Monocytes tissue to a procedural error made by the study’s original authors: We found that the pepXML-formatted search result file corresponding with ‘bRP_Elite’ analysis, which we downloaded from the PRIDE database (PXD000561) was identical to the ‘bRP_Velos’ pepXML file. The raw data files corresponding with these two conditions were clearly distinct, and were used as input to TagGraph. This spike in identifications can only partially be attributed to TagGraph’s enhanced identification capabilities. b) Immunostaining images taken from ProteinAtlas (Uhlén, M. et al. Tissue-based map of the human proteome. Science (80-.). (2015)) for select proteins identified by TagGraph but were not reported by Kim et al. Specific images available from v18.1.proteinatlas.org as follows: Q97NJ3/Testis: Thumbnail (shown): https://www.proteinatlas.org/images/49212/134029_A_6_6_rna_selected_medium.jpg. Thumbnail source: https://www.proteinatlas.org/ENSG00000267508-ZNF285/tissue/testis#imid_16514384 (zoom to 50 um, rotate). Q9BYG8/Kidney: Thumbnail (shown): https://www.proteinatlas.org/images/26317/147458_A_8_5_rna_selected_medium.jpg. Thumbnail source: https://www.proteinatlas.org/ENSG00000147697-GSDMC/tissue/kidney#imid_18255367 (zoom to 50 um). Q99525/Colon:Thumbnail (shown): https://www.proteinatlas.org/images/42201/107797_A_7_3_rna_selected_medium.jpgl. Thumbnail source: https://www.proteinatlas.org/ENSG00000275663-HIST1H4G/tissue/colon#imid_13119569 (zoom to 50 um, rotate). Q15034/Liver: Thumbnail (shown): https://www.proteinatlas.org/images/39170/84112_A_8_4_rna_selected_medium.jpg. Thumbnail source: https://www.proteinatlas.org/ENSG00000138641-HERC3/tissue/liver#imid_10163143 (zoom to 50 um). Q96BD5/Testis: Thumbnail (shown): https://www.proteinatlas.org/images/23580/106196_A_6_6_rna_selected_medium.jpg. Thumbnail source: https://www.proteinatlas.org/ENSG00000135365-PHF21A/tissue/testis#imid_12921312 (zoom to 50 um). P61962/Frontal Cortex: Thumbnail (shown): https://www.proteinatlas.org/images/22948/49904_B_7_5_rna_selected_medium.jpg. Thumbnail source: https://www.proteinatlas.org/ENSG00000136485-DCAF7/tissue/cerebral+cortex#imid_5852904 (zoom to 50 um). Q15651/Colon: Thumbnail (shown): https://www.proteinatlas.org/images/18370/41692_A_7_3_rna_selected_medium.jpg. Thumbnail source: https://www.proteinatlas.org/ENSG00000118418-HMGN3/tissue/colon#imid_4795066 (zoom to 50 um, rotate). Q8IUC6/Liver: Thumbnail (shown): https://www.proteinatlas.org/images/42460/97858_A_7_4_rna_selected_medium.jpg. Thumbnail source: https://www.proteinatlas.org/ENSG00000127666-TICAM1/tissue/liver#imid_11877414 (zoom to 50 um)
Supplementary Figure 9 Examples of high-scoring peptide-spectrum matches with deviant monoisotopic mass assignments rescued by TagGraph.
Pairs of MS1 and MS/MS spectra are shown above one another, both assigned to the same peptide with EM-estimated probabilities above our selection threshold (0.99). The top MS/MS spectrum yielded an acceptably low mass deviation (ppm) whereas the bottom spectrum would be excluded from analysis using a rigid mass deviation filter. The MS/MS spectra are obviously similar, and the mass deviations can be explained by computational errors in the initial monoisotopic mass assignment. TagGraph rescues such MS/MS spectrum assignments by considering mass deviation as one of several peptide attributes which contribute to a peptide-spectrum match’s overall confidence (Supplementary Fig. 2).
Supplementary Figure 10 TagGraph is compatible, though less effective, with low-resolution tandem mass spectra.
a) Over 300,000 MS/MS spectra from 33 lung-derived LC-MS/MS runs (Peptide Atlas PAe001771; used in the Wilhelm et al. draft of the human proteome) were searched with TagGraph (blue), and compared with the original X!Tandem search results (orange) or SEQUEST (green). The total number of high-confident identifications TagGraph made was 2.4x greater than those originally reported with the X!Tandem approach, but 2.0x less than those found with SEQUEST. Spectra for which TagGraph and the traditional database search algorithm returned high-confidence identifications agreed at rates >99% (square brackets). The low overall rates of confident identifications from all search methods (for example, 9.3% of all acquired spectra were confidently assigned by TagGraph) is much less than was observed for the high-resolution lung dataset reported by Kim et al. (~50%). b) TagGraph added dozens of modifications to this this dataset, in similar proportions to the Kim et al. dataset. The majority of modifications from both datasets were consistent with post-isolation, rather than biological modifications.
Supplementary Figure 11 Motif-X analysis for known PTMs reveals known and novel substrate motifs.
Motifs identified by the Motif-X algorithm (Schwartz, D. & Gygi, S. P. An iterative statistical approach to the identification of protein phosphorylation motifs from large-scale datasets. Nat. Biotechnol. 23, 1391–8 (2005)) surrounding several abundant PTMs. This analysis recovers known motifs for phosphoserine, phosphothreonine, dimethyl arginine, and methyl arginine PTMs, and predicts new motifs for the less well-characterized proline hydroxylation and lysine glucosylgalactosylation PTMs. Fraction indicates the number of times the indicated motif was identified out of the total number of modification sites entered into the Motif-X algorithm.
Supplementary Figure 12 Accounting for ontologies enriched among post-isolation modifications.
Gene ontology enrichment analyses of PTM-bearing proteins may be biased by mass spectrometers’ tendency towards identifying modified peptides from highly abundant proteins. Consequently, some ontologies could reach statistical significance based on protein abundance alone, rather than PTM-specific biological phenomena. To account for this, we identified significantly enriched ontologies (1% FDR, Benjamini-Hochberg corrected; yellow) among proteins bearing any of 15 abundant post-isolation modifications. Because these modifications should not have any inherent biological relevance, any ontology enriched among these post-isolation modifications were deemed false (red brackets), and removed from the analysis presented in Fig. 4b.
Supplementary Figure 13 Modification abundances and estimated stoichiometries are not correlated with protein abundances.
Scatter plots of protein normalized spectral abundances factor (NSAF) with estimated modification stoichiometry (left) or modification normalized spectral counts (NSC, right). In both cases, modification abundance did not correlate (Pearson) with protein abundance.
Supplementary Figure 14 Proteins that correlate with PTM substrates share functional properties.
a) Expression level (NSAF) profiles for 15,747 proteins spanning 30 tissues were correlated with averaged PTM profiles across the same tissues, using either estimated stoichiometry or normalized spectral counts (NSC). The representative scatter plot shown here for lysine hydroxylation indicates the extent to which each protein’s tissue profile (points) correlates with lysine hydroxylation across the 30 tissues as measured by estimated stoichiometry (x-axis) or total abundance (y-axis). These data show that the two PTM quantification methods are broadly similar. However, protein correlation (Pearson) ranks may differ greatly between the two quantification methods. Thus, both can produce complementary but similar sets of highly correlated proteins. b) Protein-PTM correlations generally did not indicate specific modified substrates. A protein’s abundance could correlate (Pearson) with a particular PTM because it regulates or directly catalyzes the PTM’s formation on its substrate. Alternatively, proteins could be correlated with a modification because they are themselves heavily-modified substrates of the PTM. Kinases, which both catalyze phosphorylation events and are themselves highly phosphorylated, would be expected to be examples of both conditions, for example. By contrast, collagens would be examples of the latter condition, as abundant proteins in certain tissues that carry a highly degree of hydroxylated prolines. To evaluate these possibilities, we first identified the 20 proteins that most highly correlated with each of the 28 PTMs shown here, as computed using either modification NSC or estimated stoichiometry. Of these, we plotted the number of proteins that were also modified by the indicated PTM. For the most part, however, PTMs were not identified on the same proteins to which they were most highly correlated, suggesting that they may be candidate regulators of PTM transfer. c) Enriched gene ontologies (p values calculated from one-tail Fisher exact test, Benjamini-Hochberg corrected) for the top fifty most correlated proteins for several PTMs suggests either enzymatic activity (that is, oxidoreductase activity is known to be required for lysine hydroxylation to occur) or common functional activity (that is, arginine dimethylation is known to be enriched in RNA splicing proteins, Fig. 4b). As demonstrated in part b, these proteins are not themselves substrates of the PTM of interest. Thus, these ontologies further suggest functional relationships between PTMs and proteins which are highly correlated with them.
Supplementary information
Supplementary Information
Supplementary Figures 1–14, Supplementary Notes 1–4 and Supplementary Table 1
Supplementary Code
Code TagGraph and supporting software used to generate data
Supplementary Data
Supplementary Analyses 1–3
Rights and permissions
About this article

Cite this article
Devabhaktuni, A., Lin, S., Zhang, L. et al. TagGraph reveals vast protein modification landscapes from large tandem mass spectrometry datasets. Nat Biotechnol 37, 469–479 (2019). https://doi.org/10.1038/s41587-019-0067-5
Received:
Accepted:
Published:
Issue Date:
DOI: https://doi.org/10.1038/s41587-019-0067-5
This article is cited by
-
Fast alignment of mass spectra in large proteomics datasets, capturing dissimilarities arising from multiple complex modifications of peptides
BMC Bioinformatics (2023)
-
metaSpectraST: an unsupervised and database-independent analysis workflow for metaproteomic MS/MS data using spectrum clustering
Microbiome (2023)
-
GPU-acceleration of the distributed-memory database peptide search of mass spectrometry data
Scientific Reports (2023)
-
Post-translational modifications reshape the antigenic landscape of the MHC I immunopeptidome in tumors
Nature Biotechnology (2023)
-
Frequency of change determines effectiveness of microbial response strategies
The ISME Journal (2023)
