
Abstract
Allergic rhinitis (AR) is increasingly becoming a patient self-managed disease. Just under 70% of patients purchasing pharmacotherapy self-select their treatment with no health-care professional intervention often resulting in poor choices, leading to suboptimal management and increased burden of AR on the individual and the community. However, no decision is made without external, influencing forces. This study aims to determine the key influences driving patients’ decision-making around AR management. To accomplish this aim, we utilised a social network theory framework to map the patient’s AR network and identify the strength of the influences within this network. Adults who reported having AR were interviewed and completed an AR network map and AR severity and quality of life questionnaires. Forty one people with AR completed the study. The AR networks of the participants had a range of 1–11 influences (alters), with an average number of 4 and a median of 5. The larger the impact of AR on their quality of life, the greater the number of alters within their network. The three most commonly identified alters were, general practitioners, pharmacists and the participants’ ‘own experience’. The strength of the influence of health-care professionals (HCPs) was varied. The proportion of HCPs within the AR network increased as the impact of AR on their quality of life increased. By mapping the AR network, this study demonstrated that there are multiple influences behind patient’s decisions regarding AR management but the role of the HCP cannot be dismissed.
Introduction
Allergic rhinitis (AR) is a chronic respiratory condition that is globally increasing in prevalence and receiving worldwide recognition for the burden associated with its suboptimal control.1,2 The seemingly innocuous symptoms of AR, which include sneezing, rhinorrhoea, nasal congestion and watery/itchy eyes, can significantly impair an individual’s quality of sleep, concentration and ability to perform their daily activities.3 In socioeconomic terms, the impact of AR has been measured to be in billions of dollars.4,5 Further to this, the burden of poorly controlled AR extends to co-morbid conditions such as asthma, making it difficult to control where AR control has not been achieved.6 Despite the acknowledgement of the consequences of poor AR control and resources devoted to tackling the issue, optimal AR control continues to be elusive.7
There are several factors that contribute to AR being a challenging condition to manage including, miscommunication between health-care professionals (HCPs) and patients about concept of AR control, the co-existence of non-AR and the suboptimal use of medicines leading to inadequate symptom relief.2,8,9,10 Where AR management has traditionally been the domain of primary HCPs such as general practitioners (GPs) and pharmacists,11,12,13,14 the availability of medicines for purchase without consulting HCPs has contributed to AR management becoming patient driven.15 A particular factor that has significant impact on AR management is the high level of patient self-selection of medications. Recent Australian research has demonstrated that just under 70% of pharmacy customers purchased a treatment for AR symptoms by self-selecting their treatment without consulting a HCP, only 15% selecting optimal treatment for their symptoms.15
While it is accepted that a majority of people with AR self-manage their condition, little is understood about who or what influences people with AR in their management decisions. Exploring AR management from the perspective of the patient has revealed that patients feel confident in making their own decisions with regards to their AR treatment16 but has so far not identified who or what are the key influencers of these decisions, what the relative level of influence is nor whether these influences change depending on the level to which AR impacts on patients’ day-to-day living. By identifying the key influences within patients’ AR networks, we can better understand both the challenges and opportunities for patients, health-care providers and the health-care system to improve AR management.
Social network theory can help us to identify a patient’s health network and the influences within it.17 This approach has been used to identify key influences within the networks of people who have asthma and has given us fresh insight into the role that HCPs and family members have on asthma management.18 Utilising a social network approach with people with AR can help us understand who and what influences patient decisions with regards to AR management.
Therefore, the overall aim of this study was to determine the influences driving patients’ decision-making around AR management, to determine their relative degree of influence and to gain an understanding of whether networks vary depending on the impact of AR on patients’ day-to-day living (quality of life (QOL)).
Results
Fifty seven potential participants contacted the research team and expressed an interest in participating in this research. Forty seven of these potential participants were eligible to participate and provided signed consent; 87% (41/47) completed the study and were included for further analysis (the remaining 6 did not complete all components of the study). Data saturation was achieved following the 20th participant, as no new alters were nominated with the name generation technique by the remaining participants. All eligible volunteers who responded to the initial round of recruitment were enrolled and participated. Once it was established that saturation had been obtained, no further recruitment was deemed necessary. The study population were aged between 18 and 86 years with a median age of 38 years. Sixty seven percent were female. Thirty four participants were from metropolitan Sydney and 7 were from regional areas of New South Wales. Data were collected from March 2014 to December 2014.
AR severity and impact on QOL
AR severity is summarised in Table 1.
The average score for the mini-RQLQ questionnaire was 2.6 (range 0–5). The number of participants in each category of AR QOL impairment was: 1 (2.4%) in QOLZERO (score 0), 20 (48.8%) in QOLMILD (score >0–2), 12 (29.3%) in QOLMOD (score 3–4), and 8 (19.5%) in QOLSEV (score 5–6).
Name generation
The participants nominated GPs; pharmacists; allergists/immunologists; respiratory specialists; ear, nose and throat specialists; practice nurses; alternative therapists; parents; partners; siblings; friends/colleagues; media; internet; their own experience; dermatologists; neurologists; optometrists and opthalmologists as individuals or resources who/that have an influence on their AR management decision-making. Dermatologists, neurologists, optometrists and opthalmologists appear on the map under the category ‘other HCPs’. Parents and partners were combined as one category and siblings are represented in the category ‘family’.
AR network: maps and bar charts
The AR Network MapTOTAL and bar chart is presented in Fig. 1a, b (n = 41). The number of alters nominated by participants ranged from 1 to 11, with an average number of 4 and a mode of 5. The three most commonly nominated alters within the AR Network MapTOTAL were GPs, pharmacists and participants’ own experience.

AR network total map (a) and bar chart (b)
GPs, pharmacist and ‘own experience’ constituted >50% of the alters in Circle One, being placed in Circle One by 15 (37%), 9 (22%), and 12 (30%) of participants, respectively. While GPs and pharmacists also featured prominently beyond Circle One, ‘own experience’ was almost entirely (except in one case) plotted within Circle One.
One participant reported that AR had no impact on their QOL. The AR network map and AR network bar chart for the participants who experienced zero AR impairment on their QOL (AR NetworkZERO) are displayed in Fig. 2a, b.

AR network map and bar chart for participants with zero (a, b) and mild (c, d) impact on quality of life
Twenty participants reported AR causing mild impairment on their QOL. The AR network map and AR network bar graph for the participants who experience mild impairment due to AR on QOL (AR NetworkMILD) are displayed in Fig. 2c, d.
Twelve participants reported AR causing moderate impairment on their QOL. The AR network map and AR network bar graph for participants experiencing moderate impairment due to AR on QOL (AR NetworkMOD) are displayed in Fig. 3a, b.

AR network map and bar chart for participants with moderate (a, b) and severe (c, d) impact on quality of life
Eight participants reported AR causing severe impact on their QOL. The AR Network map and AR Network bar graph for participants experiencing severe impairment due to AR on QOL (AR NetworkSEV) are displayed in Fig. 3c, d.
AR network alter density
Figure 4 displays the AR network alter density figure for the total AR network (AR Network Alter DensityTOTAL) and for the AR networks per QOL category (AR Network Alter DensityQOLzero, AR Network Alter DensityQOLmild, AR Network Alter DensityQOLmod and AR Network Alter DensityQOLsev, respectively).

AR network alter densities relative to impact on quality of life
Discussion
This research identifies that people with AR report a wide range of influences when it comes to the management of their AR. These influences include HCPs, family and friends and information from the internet and media. When these influences are visually represented in an egocentric network map, it is evident that GPs, pharmacists and the patient’s own experience are consistently regarded as key influences on AR management. It was found that, as the impact of AR on QOL increases, the size of the patient’s AR network also increases. These findings uncover a complex network of influence for people with AR, which needs to be considered in light of the high level of self-management exemplified by this cohort of patients.
In order to address the aims of this study, a methodology embedded with social network theory was utilised. The reasons for utilising a patient-centric social network approach was based on two key empirical findings: (a) there is a high level of self-management on the part of the patient and (b) this approach was successfully used to identify novel understanding of the influence on patient self-management in asthma.15,18 This method enabled us focus on the patient's perspective and to specifically articulate the relative importance placed on the many and varied ‘influences’, as experienced by the patient. However, it should be acknowledged that this method represents a one-dimensional description of the patient’s AR network. To further enhance the interpretation of the data collected through the egocentric social network approach, network alter density calculations were applied. This added a deeper level of understanding to the relative importance of the different influences and adds novelty to this established method of patient-centred data collection.18
This research unequivocally demonstrates that the size and the composition of the AR network changes as impact of AR on QOL increases. Participants experiencing severe impact of AR on QOL have the largest networks. We often associate uncontrolled AR with an absence of HCP involvement,15 yet these results reveal that AR patients who experience severe impairment on their QOL identify many HCPs to be of influence within their network for AR management. The inclusion of HCPs whose specialties are not normally associated with AR management (e.g. neurologists) by this subgroup of patients suggests either the impact of AR extends beyond the respiratory system or patients feel that they are not receiving sufficient support from their primary HCP and are looking more broadly for assistance. These results clearly articulate that, in an era of treatment self-selection15 and patient empowerment,16 from the patient’s perspective HCPs remain relevant but not exclusive to the management of AR. The challenge for HCPs lies in harnessing this influence and ensuring optimal care is delivered, despite other influences, which in terms of clinical decision-making is yet unknown.
GPs appear in the AR network of the majority of patients. Following on from this, those with more severe disease consult their GPs and also have larger networks. This is an important finding in light of the fact that people with moderate-to-severe disease represent the majority of people consulting a GP,19 that is, it is the subgroup of people with AR who have large health networks and who are likely to be consulting the GP. In thinking about how GPs can potentially amend their approach to AR management to assist the patients with the greatest burden of disease, we need to recognise the challenges they face in managing AR. A key challenge relates to the fact that diagnosis of AR can be complicated20,21,22 and many GPs have expressed great educational need with regards to allergy management.23 With a limited supply per capita of allergists/immunologists (and availability of sub-lingual immunotherapy in primary care), the role of the GP in treating allergy has never been more important and upskilling our HCPs may be the solution to minimising AR-related impact on QOL in the community.21,24
Another HCP identified as being influential in AR management is the pharmacist. With the pharmacist, there was a high variability in the level of influence, which was noted. While it can be argued that it is the patient’s choice as to how they ‘utilise’ the pharmacist in the management of their AR, it can also be argued that, given the current availability of medicines for AR in the pharmacy, they are the first port of call for AR management. Allergic Rhinitis and its Impact on Asthma (ARIA) guidelines include pharmacists in their integrated pathway as the starting point to treatment and management, but with so many medicines available over the counter,25,26 we need to consider pharmacists’ skills and the resources available to them.
The inclusion of non-HCPs in the AR network demonstrates that as HCPs we must be conscious that people who are not medically trained may be influencing the decision-making of people with AR. The role of non-HCP influences have previously been identified as important in the management of asthma27; however, we are yet to understand the nature of their influence in AR. We need to ensure that patients with AR are themselves equipped with appropriate knowledge and understanding that their AR is more than a trivial condition. The need for patients to be better equipped in decision-making is highlighted in the high level of influence placed on patients’ ‘own experience’ in this study. Our previous findings demonstrate that a subset of people with AR believe they themselves know what works best to control their AR symptoms while experiencing treatment fatigue and disillusionment with HCP encounters.16 Patients need to be provided with tools to assist them and an example of such a tool is The Allergy Diary (ARIA).26,28 The Allergy Diary is a mobile health application that facilitates self-monitoring and collaboration with their HCPs. Further exploration of how the Allergy Diary could be implemented to address the challenges identified in this research should be undertaken in the future.
This research leaves us with several unanswered questions. Following on from this research and the identification of patient influences, it is now essential we gain an understanding of the nature of the relationships between the patient and influences and how these relationships are impacting on patient AR decision-making and one another. In particular, we must investigate patient reports of ‘own experience’ as a key influence of their AR management and whether it is a summation of previous encounters with other alters or entirely based on experimentation with over-the-counter treatments. We must also investigate what factors determine perceived level of influence and how we can use this information to optimise AR clinical outcomes. Without further information about the nature of the perceived influences and the reasons behind them, we cannot make direct connections about the nature of these influences and impact of them on AR clinical outcomes.
This study was limited by the recruitment of participants solely from New South Wales, Australia. Even though the demographics of the study population are representative of the AR population,29 i.e. skewed towards mild disease, a greater distribution of AR severities could potentially strengthen our understanding. A further limitation is that AR was self-reported by participants but unconfirmed (nor formal diagnosis). While this is consistent with findings in the Australian population, some of which report that 60% of individuals self-diagnose their AR30, ways in which to overcome this limitation should be considered in future. Variation in patient responses to AR severity and impact on QOL questionnaires (>60% of participants reported moderate-to-severe disease severity yet reported even distribution in mild versus moderate–severe categories of QOL impairment) exemplified the challenges and controversies surrounding the use of these clinical tools in AR.31 Having only one patient in the no impact group subsequently limited our understanding of the AR networks of people experiencing no impairment on their QOL due to AR and a larger representation of participants in this subgroup is required in future research.
In conclusion, this research has delved into the world of the patient with AR and their AR network. The most striking new knowledge generated from this research is the finding that there is a disconnect between the impact of AR on patient day-to-day living and the number of influences on which patients with AR reply. In all of this, we need to understand why the influence of HCPs is not optimising AR control and why patients feel they need so many other influences on their AR management. Understanding the effectiveness of HCPs in AR management and better supporting them to be effective is one key challenge in the real-life management of AR that needs to be addressed as a priority.
Methods
Study design
This study used a mixed methods approach based on the theoretical and analytical framework of social network theory as previously developed and utilised by Cheong et al.32 Specifically, this study used an egocentric social network framework; it focused on the network of an individual/‘ego’ (the participant) and the relationships/‘ties’ with individuals or resources/‘alters’.
Study population
Inclusion criteria
The target population was people aged ≥18 years who identified themselves as having AR and able to speak English.
Recruitment
Advertisements were placed on the Woolcock Institute of Medical Research’s website and Facebook page. Letters were sent to individuals who were on the Woolcock volunteers’ database of patients (i.e. patients with AR who have previously either participated in research or expressed an interest in participating in research). Respondents who registered an interest were asked to contact the research team. Participation was voluntary. Written, informed consent was obtained from participants prior to commencement in the study.
Sample size
In an egocentric social network analysis, recruitment continues until data saturation is reached, that is no new alters are identified among individual health network maps.
Data collection
In order to address the aim, the following methods were implemented during an appointment with a member of the research team:
-
1.
Determination of AR severity and impact on QOL
-
2.
Name generator technique
-
3.
Drawing of the AR network
Participants were given the option of face-to-face or telephone interview. Those who chose to participate via the telephone were emailed/posted the study documentation for reference during the telephone call. All interviews were audio-recorded and transcribed verbatim.
-
1.
AR severity and QOL was determined by participant completed questionnaires.30,33
-
2.
The name generator technique34 was a structured interview where the participant was asked to identify alters (individuals or resources) with whom they have discussed their AR within the past 5 years. A predetermined list of potential alters, generated from AR literature29,35,36 and exploratory inquiry, was used as secondary prompts in this process.
-
3.
Drawing the AR network: An adapted concentric circle framework was used as the basis for the generation of each AR network map.37 The participant was asked to visually depict their relationship with each of their alters with respect to their influence on their AR management by plotting them on a concentric circle diagram (Fig. 5).
Fig. 5 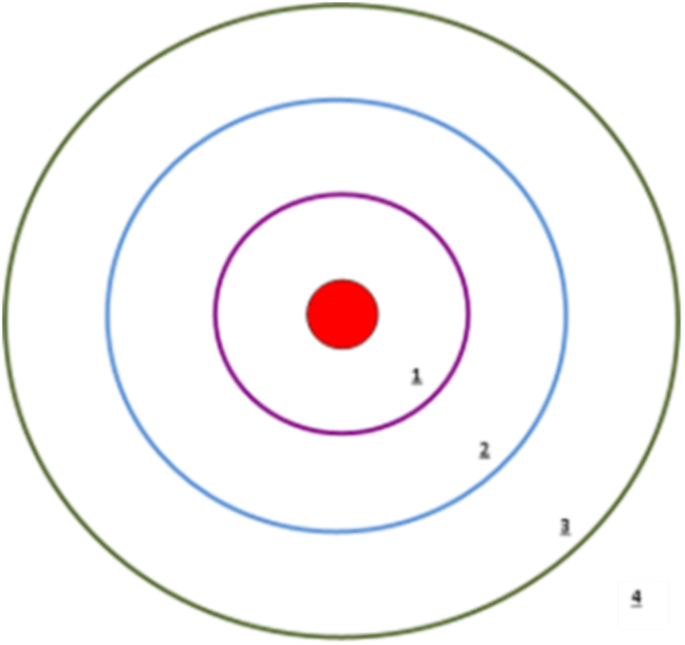
Concentric circle diagram

It was explained to each participant that they are represented by the red spot in the middle of the concentric circles (Fig. 5). Further to this, Circle One, closest to the centre, represented the circle on which to place the alter(s) who/that were most influential with regards to their AR management. Circle Four, the furthest away, represented the alter(s) who/that were of little influence on their AR management.
Data analysis
AR severity and impact on QOL
Based on participant responses to the AR severity questionnaire, their AR severity was categorised into one of the respective five AR severity categories: no AR, mild intermittent, moderate to severe intermittent, mild persistent, and moderate to severe persistent.
Responses to the mini-RQLQ questionnaire were categorised into four groups: no impairment (QOLZERO, score zero), mild impairment (QOLMILD, score >0–2), moderate impairment (QOLMOD, score 3–4), and severe impairment (QOLSEV, score 5–6).
Name generator technique
A list of alters nominated by participants was created including additional notes on whether any new alters had been identified since the previous participant’s interview.
AR Network maps and bar graphs
The AR network maps were drawn using NetDraw.38,39 Data were entered into a VNA file (format used by the NetDraw program to numerically represent alters and strength of connection) based on position of alters across the concentric circles, with values assigned to each alter corresponding to the circle in which the alter was plotted. An AR network map collating all participants’ individual maps was drawn (AR Network MapTOTAL). Individual AR network maps for all participants were drawn, as were AR network maps for subgroups of participants, i.e. for participants in each of the four QOL categories (AR Network MapZERO, AR Network MapMILD, AR Network MapMOD, AR Network MapSEV). AR network bar graphs were drawn to quantitatively depict these AR network maps.
AR network alter density figure
In social network theory, network density measures the proportion of ties within a network relative to the total possible number of ties.17 In this egocentric network, network density principles were applied to represent the proportion (or relative influence) of alters within the network. In order to determine the network alter density, the strength of the tie was considered, which in an egocentric network is exemplified by the length of the tie, i.e. the placing of the alter on Circle 1, 2, 3 or 4. In an egocentric network, the strongest tie is that between the ‘ego’ and alters placed on Circle One; the weakest tie is that between the ‘ego’ and alters placed on Circle Four. Therefore, to capture the significance of the positioning of alters (and the strength of the ties), network density was calculated using the following formula:
where C1 = Circle One and a weighting of 4, C2 = Circle Two and a weighting of 3, C3 = Circle Three and a weighting of 2 and C4 = Circle Four and a weighting of 1; n1C1 relates to the number of participants who placed a particular alter in Circle One; n2C2 relates to the number of participants who placed a particular alter in Circle Two, n3C3 relates to the number of participants who placed a particular alter in Circle Three, and n4C4 relates to the number of participants who placed a particular alter in Circle Four.
In this study, the network alter density enables the determination of the overall influence of alters for the participant population as a whole, i.e. the influence of particular individuals or resources for people with AR. The larger the value of density of the alter, the more the influence within the network.
AR network alter density was calculated for the AR Network MapTOTAL and the AR NetworkQOLzero, AR NetworkQOLmild, AR NetworkQOLmod and AR NetworkQOLsev subgroup maps and represented in a bar graph.
This study was approved by the University of Sydney Human Research Ethics Committee and was completed in accordance with STROBE guidelines for observational research.40
Data availability
The datasets generated and analysed during the current study are not publicly available because consent was not obtained from the participants to release study data.
References
Bousquet, J. et al. Transfer of innovation on allergic rhinitis and asthma multimorbidity in the elderly (MACVIA-ARIA) - EIP on AHA Twinning Reference Site (GARD research demonstration project). Allergy 73, 77–92 (2018).
Price, D. et al. Current controversies and challenges in allergic rhinitis management. Expert Rev. Clin. Immunol. 11, 1205–1217 (2015).
Greiner, A. N., Hellings, P. W., Rotiroti, G. & Scadding, G. K. Allergic rhinitis. Lancet 378, 2112–2122 (2011).
Meltzer, E. O., Farrar, J. R. & Sennett, C. Findings from an online survey assessing the burden and management of seasonal allergic rhinoconjunctivitis in US patients. J. Allergy Clin. Immunol. Pract. 5, 779.e6–789.e6 (2017).
Hellgren, J., Cervin, A., Nordling, S., Bergman, A. & Cardell, L. O. Allergic rhinitis and the common cold – high cost to society. Allergy 65, 776–783 (2010).
Khan, D. A. Allergic rhinitis and asthma: epidemiology and common pathophysiology. Allergy Asthma Proc. 35, 357–361 (2014).
Mehuys, E. et al. Self-medication in persistent rhinitis: overuse of decongestants in half of the patients. J. Allergy Clin. Immunol. Pract. 2, 313–319 (2014).
Schroer, B. & Pien, L. C. Nonallergic rhinitis: common problem, chronic symptoms. Clevel. Clin. J. Med. 79, 285–293 (2012).
Segboer, C. L. et al. Nasal hyper-reactivity is a common feature in both allergic and nonallergic rhinitis. Allergy 68, 1427–1434 (2013).
Nolte, H., Nepper-Christensen, S. & Backer, V. Unawareness and undertreatment of asthma and allergic rhinitis in a general population. Respir. Med. 100, 354–362 (2006).
Smith, L., Brown, L., Saini, B. & Seeto, C. Strategies for the management of intermittent allergic rhinitis: an Australian study. Health Expect. 17, 154–163 (2014).
Walls, R. S. et al. Optimising the management of allergic rhinitis: an Australian perspective. Med. J. Aust. 182, 28–33 (2005).
Canonica, G. W., Triggiani, M. & Senna, G. 360 degree perspective on allergic rhinitis management in Italy: a survey of GPs, pharmacists and patients. Clin. Mol. Allergy 13, 25 (2015).
Lourenco, O., Calado, S., Sa-Sousa, A. & Fonseca, J. Evaluation of allergic rhinitis and asthma control in a Portuguese community pharmacy setting. J. Manag. Care Spec. Pharm. 20, 513–522 (2014).
Tan, R. et al. Identifying the hidden burden of allergic rhinitis (AR) in community pharmacy: a global phenomenon. Asthma Res. Pract. 3, 8 (2017).
Cvetkovski, B., Kritikos, V., Yan, K. & Bosnic-Anticevich, S. Tell me about your hay fever: a qualitative investigation of allergic rhinitis management from the perspective of the patient. NPJ Prim. Care Respir. Med. 28, 3 (2018).
Valente, T. W. Social Networks and Health. Models, Methods and Applications (Oxford University Press, Oxford, 2010).
Cheong, L. H. M., Armour, C. L. & Bosnic-Anticevich, S. Z. Primary health care teams and the patient perspective: a social network analysis. Res. Social Adm. Pharm. 9, 741–757 (2013).
Bousquet, J. et al. Severity and impairment of allergic rhinitis in patients consulting in primary care. J. Allergy Clin. Immunol. 117, 158–162 (2006).
Roberts, G. et al. A new framework for the interpretation of IgE sensitization tests. Allergy 71, 1540–1551 (2016).
Flokstra-de Blok, B. M. et al. Development of an allergy management support system in primary care. J. Asthma Allergy 10, 57–65 (2017).
Smith, H. E., Hogger, C., Lallemant, C., Crook, D. & Frew, A. J. Is structured allergy history sufficient when assessing patients with asthma and rhinitis in general practice? J. Allergy Clin. Immunol. 123, 646–650 (2009).
Ryan, D. et al. Results of an allergy educational needs questionnaire for primary care. Allergy 72, 1123–1128 (2017).
Jutel, M. et al. Improving allergy management in the primary care network – a holistic approach. Allergy 68, 1362–1369 (2013).
Bousquet J., Cauwenberge P. & KhaltaevN. ARIA in the pharmacy: management of allergic rhinitis symptoms in the pharmacy. Allergy 59, 373–387 (2004).
Bousquet, J. et al. ARIA 2016: care pathways implementing emerging technologies for predictive medicine in rhinitis and asthma across the life cycle. Clin. Transl. Allergy 6, 47 (2016).
Cheong, L. H., Armour, C. L. & Bosnic-Anticevich, S. Z. Patient asthma networks: understanding who is important and why. Health Expect. 18, 2595–2605 (2015).
Bousquet, J. et al. MACVIA clinical decision algorithm in adolescents and adults with allergic rhinitis. J. Allergy Clin. Immunol. 138, 367.e2–374.e2 (2016).
Australian Institute of Health and Welfare. Allergic Rhinitis (Hayfever) in Australia (AIHW, Canberra, 2011).
Bosnic-Anticevich, S. et al. Lack of asthma and rhinitis control in general practitioner-managed patients prescribed fixed-dose combination therapy in Australia. J. Asthma 55, 684–694 (2017).
Demoly, P. et al. Assessment of disease control in allergic rhinitis. Clin. Transl. Allergy 3, 7 (2013).
Cheong, L. H., Armour, C. L. & Bosnic-Anticevich, S. Z. Primary health care teams and the patient perspective: a social network analysis. Res. Social Adm. Pharm. 9, 741–757 (2013).
Juniper, E. F., Thompson, A. K., Ferrie, P. J. & Roberts, J. N. Development and validation of the mini Rhinoconjunctivitis Quality of Life Questionnaire. Clin. Exp. Allergy 30, 132–140 (2000).
Marin, A. & Hampton, K. N. Simplifying the personal network name generator: alternatives to traditional multiple and single name generators. Field Methods 19, 163–193 (2007).
Blaiss, M. S. et al. Current Allergic Rhinitis Experiences Survey (CARES): Health-care practitioners’ awareness, attitudes and practices. Allergy Asthma Proc. 35, 316–322 (2014).
Bousquet, J. et al. Allergic Rhinitis and its Impact on Asthma (ARIA) 2008 update (in collaboration with the World Health Organization, GA(2)LEN and AllerGen). Allergy 63, 8–160 (2008).
Cheong, L. H., Armour, C. L. & Bosnic-Anticevich, S. Z. Primary health care teams and the patient perspective: a social network analysis. Res. Social Adm. Pharm. 9, 741–757 (2013).
NetDraw Software for Network Visualization (Analytic Technologies, 2002).
Borgatti, S. A Brief Guide to Using NetDraw www.analytictech.com/Netdraw/NetdrawGuide.doc (2015).
von Elm, E. et al. The Strengthening the Reporting of Observational Studies in Epidemiology (STROBE) Statement: guidelines for reporting observational studies. Bull. World Health Organ. 85, 867–872 (2007).
Acknowledgements
We would like to acknowledge the participants who volunteered to be part of this research. No funding was received for this research.
Author information
Authors and Affiliations
Contributions
B.C., V.K., K.Y. and S.B.-A. are responsible for the study design. B.C. and S.B.-A. are the guarantors for this work. B.C. collected the data. B.C. and S.B.-A. created the database. R.T. drew network maps and compiled figures. E.A. analysed disease status questionnaires. P.S. drew network map bar graphs. B.C., S.B.-A. and V.K. analysed the data. B.C. drafted the manuscript, which went through multiple rounds of discussion and feedback with S.B.-A., K.Y., V.K., R.T., E.A. and P.S. All authors have seen and approved the final version of this manuscript.
Corresponding author
Ethics declarations
Competing interests
S.B.-A. is a member of the Teva Pharmaceuticals Devices International Key Experts Panel, has received research support from Research in Real Life, has received lecture fees and payment for developing educational presentations from Teva and Mundipharma and has received honoraria from AstraZeneca, Boehringer Ingelheim and GlaxoSmithKline for her contribution to advisory boards/key international expert forum. V.K. has received honoraria from AstraZeneca, GlaxoSmithKline and Pfizer. K.Y. has received honoraria for speaking and consulting from AstraZeneca, Boehringer Ingelheim, GlaxoSmithKline, Meda, Mundipharma and Pfizer. The other authors declare no competing interests.
Additional information
Publisher's note: Springer Nature remains neutral with regard to jurisdictional claims in published maps and institutional affiliations.
Electronic supplementary material
Rights and permissions
Open Access This article is licensed under a Creative Commons Attribution 4.0 International License, which permits use, sharing, adaptation, distribution and reproduction in any medium or format, as long as you give appropriate credit to the original author(s) and the source, provide a link to the Creative Commons license, and indicate if changes were made. The images or other third party material in this article are included in the article’s Creative Commons license, unless indicated otherwise in a credit line to the material. If material is not included in the article’s Creative Commons license and your intended use is not permitted by statutory regulation or exceeds the permitted use, you will need to obtain permission directly from the copyright holder. To view a copy of this license, visit http://creativecommons.org/licenses/by/4.0/.
About this article

Cite this article
Cvetkovski, B., Tan, R., Kritikos, V. et al. A patient-centric analysis to identify key influences in allergic rhinitis management. npj Prim Care Resp Med 28, 34 (2018). https://doi.org/10.1038/s41533-018-0100-z
Received:
Revised:
Accepted:
Published:
DOI: https://doi.org/10.1038/s41533-018-0100-z
This article is cited by
-
Development and validation of a pharmacist-led education model in allergic rhinitis management: a multi-phase study
Journal of Pharmaceutical Policy and Practice (2023)
-
Conception and pilot testing of a self-management health application for patients with pollen-related allergic rhinitis and allergic asthma-the APOLLO app
Scientific Reports (2023)
-
A qualitative investigation of the allergic rhinitis network from the perspective of the patient
npj Primary Care Respiratory Medicine (2019)
-
Exploring the Asthma Network in People with Allergic Rhinitis Utilizing an Egocentric Social Network Analysis
Pulmonary Therapy (2019)
