
Abstract
Interpreting the susceptible loci documented by genome-wide association studies (GWASs) is of utmost importance in the post-GWAS era. Since most complex traits are contributed by multiple tissues, analyzing tissue-specific effects of expression quantitative trait loci (eQTLs) is a promising approach. Here we describe “opposite eQTL effects”, i.e., gene expression effects of eQTLs that are in the opposite direction between different tissues, as the biologically meaningful annotations of genes and genetic variants for understanding the GWAS loci. The genes and single-nucleotide polymorphisms (SNPs) associated with the opposite eQTL effects (opp-multi-eQTL-Genes and opp-multi-eQTL-SNPs) were extracted from the largest eQTL database provided by the Genotype-Tissue Expression (GTEx) project (release version 7). The opposite eQTL effects were detected even between closely related tissues such as cerebellum and brain cortex, and a significant proportion of the genes having eQTLs were annotated as the opp-multi-eQTL-Genes (2,323 out of 31,212; 7.4%). The opp-multi-eQTL-SNPs showed locational enrichment at the transcription start site and also possible involvement of epigenetic regulation. The biological importance of the opposite eQTL effects was also assessed using the SNPs reported in GWASs (GWAS-SNPs), which demonstrated that a high proportion of the opp-multi-eQTL-SNPs are in linkage disequilibrium with the GWAS-SNPs (2,498 out of 9,290; 26.9%). Based on the results, the opposite eQTL effects can be a common phenomenon in the tissue-specific gene regulation with a possible contribution to the development of complex traits.
Introduction
Genome-wide association studies (GWASs) have documented thousands of susceptible loci, mostly single-nucleotide polymorphisms (SNPs), that may have causal effects on the complex traits such as height, body mass index, and disease prevalence [1]. However, most of the susceptible loci were found in non-coding regions of the genome, and the biological mechanisms underlying the associations are poorly understood [2]. Therefore, in this so-called post-GWAS era, collecting biologically meaningful annotations of genes and genetic variants is essential for interpreting the results of GWASs [3].
Building functional annotation database started as the large-scale projects in 2000s, represented by FANTOM [4], ENCODE [5], and Roadmap Epigenomics [6] projects. Collecting higher-order functional information, e.g., 4D-Nucleome project [7], is also undergoing. The Genotype-Tissue Expression (GTEx) project was launched in 2010 as one of those large-scale functional annotation projects, and it is focused on mapping expression quantitative trait loci (eQTLs) for various tissues to elucidate the genetic variants underlying altered gene expression [8, 9]. The change of gene expression levels is such a fundamental trait influencing the functions of cells and tissues that the large eQTL catalog obtained by the GTEx project would be a strong basis for interpreting the GWAS loci [10]. Most importantly, revealing the tissue-specific pattern of gene regulation would give a clue to understand the biological causes of complex traits involved by multiple tissues [11]. Since the GTEx project produced the largest eQTL database by analyzing 48 tissues from 620 donors (release version 7), it gives us a valuable opportunity to explore tissue-specific effects of eQTLs as the biologically meaningful annotations of genes and genetic variants.
In the context of the tissue-specific eQTL effects, it is interesting to focus on the phenomenon that the direction of eQTL effects on a given gene is discordant depending on the tissue type, because those eQTL effects could be the factors distinguishing characteristics of the tissues [12]. The characteristic difference would be larger and hence be relevant to the development of biological traits, when the discordance is detected as “opposite eQTL effects”, i.e., the gene expression effects of eQTLs are in the opposite direction between different tissues. Discovery of SNPs with such opposite eQTL effects was previously reported in GWASs in conjunction with eQTL studies [13, 14], indicating their possible contribution to the complex traits including disease prevalence.
However, due to the significant limitation of the number of tissue types and sample size available for the eQTL analysis, reports on the opposite eQTL effects are still rare compared to the enormous number of eQTL studies, and their statistical aspects are poorly documented despite their possible importance in understanding the results of GWASs. Moreover, analyzing the opposite eQTL effects based on the primary, or most significant, eQTL signals with the linkage disequilibrium (LD) relationship taken into account has not been performed. The most significant eQTL variants are enriched at the transcription start site (TSS) to be the most likely functional variants [15]. Therefore, for the accurate assessment of the discordance of the eQTL effects on a given gene between different tissues, it is necessary to compare the direction of the primary eQTL signals of SNPs in LD.
We here report the statistics of the genes and SNPs associated with the opposite eQTL effects in the latest version of the GTEx database via full evaluation of the LD relationship between SNPs with the most significant eQTL signal in each tissue. Biological properties of the opposite eQTL effects were assessed by enrichment analysis on the distance from TSS and epigenetic annotations. Their biological importance was also investigated by LD analysis against SNPs reported in the GWAS catalog [16].
Materials and methods
Extraction of gene/SNP pairs with the most significant eQTL signal in each tissue from the GTEx database
The significant variant-gene association results of the single-tissue cis-eQTL analysis for 48 tissues were downloaded from the GTEx portal website (release version 7, file name: GTEx_Analysis_v7_eQTL.tar.gz;https://www.gtexportal.org/). The significance level threshold for eQTL effects was reported in the original paper of the GTEx project [9]. dbSNP-based rsID was used for description of SNPs. For the rsIDs that appeared in this article, their corresponding description based on the human genome reference sequence (GRCh37) is summarized in Supplementary Table S1. From the downloaded GTEx data, indel variants, multi-allelic SNPs, and SNPs not included in the 1000 genomes project results (phase 3, version 5; http://www.internationalgenome.org/) [17] were removed. Genes that have at least one SNP with an eQTL signal in one or more tissues, denoted by eQTL-Genes, were extracted as eQTL-Gene and SNP pairs, resulting in 6,895,474 pairs (31,212 genes, 2,842,590 SNPs). From the eQTL-Gene and SNP pairs, SNPs that showed the smallest p-value in each tissue, denoted by top-eQTL-SNPs, were then extracted as eQTL-Gene and top-eQTL-SNP pairs, resulting in 232,457 pairs (31,212 genes, 210,878 SNPs). In the case that there were more than one top-eQTL-SNPs in a single tissue, i.e., multiple SNPs showed the identical smallest p-value due to the strong LD relationship, the lexicographically first rsID was designated as the top-eQTL-SNP for the tissue.
Analysis of directional difference of eQTL effects between different two tissues
Between different two tissues, the directional difference of primary eQTL effects was assessed based on a 2 × 2 analysis table, as summarized in Supplementary Fig. S1. The analysis table was made for each eQTL-Gene between each tissue pair (35,207,136 analysis tables in total for 31,212 eQTL-Genes and 1128 tissue pairs from 48 tissues). Let SNP-x be the top-eQTL-SNP of a given eQTL-Gene in tissue-x, and βxy be the effect size of SNP-x in tissue-y (if SNP-x is not significantly detected in tissue-y, βxy was set as 0). Only the cases that the given eQTL-Gene has SNP(s) with a significant eQTL signal in both tissues in the pair (i.e., βxx ≠ 0 ∩ βyy ≠ 0) were moved into the next analysis (3,540,453 analysis tables). When at least one of SNP-x and SNP-y is significant in both tissues (i.e., βxy ≠ 0 ∪ βyx ≠ 0), the directional difference of the eQTL effects between the tissue pair can be discussed. Therefore, the cases of (i) SNP-x and SNP-y are identical (i.e., βxx = βyx and βxy = βyy) and (ii) SNP-x and SNP-y are not identical but at least one of them is significant in both tissues were selected (2,488,564 analysis tables). The directional difference of the eQTL effects between the tissue pair was first determined by the sign of βxx × βxy and βyx × βyy, and the cases of βxx × βxy ≤ 0 ∩ βyx × βyy ≤ 0 were considered as opposite direction. Next, the r2 coefficient of the LD between SNP-x and SNP-y were calculated by PLINK software (version 1.9; https://www.cog-genomics.org/plink2) [18] using the 1000 genomes project data as the reference panel (EUR population), and the analysis tables were divided into four groups (1a, 1b, 2a, and 2b shown in Fig. S1) based on r2 threshold of 0.8 (if SNP-x and SNP-y are identical, r2 was set as 1). The eQTL-Genes and top-eQTL-SNPs in group 1a or 2a (any direction, r2 > 0.8) were designated as multi-eQTL-Genes and multi-eQTL-SNPs (113,274 pairs consisting of 17,192 genes and 101,621 SNPs), and those in group 1a (opposite direction, r2 > 0.8) were designated as opp-multi-eQTL-Genes and opp-multi-eQTL-SNPs (9541 pairs consisting of 2323 genes and 9290 SNPs).
Clustering analysis of tissue types based on opposite eQTL effect fractions
In each tissue pair from 48 tissues (1128 pairs in total), β-values of all SNPs included in the significant eQTL analysis result dataset were compared between the tissues, and the proportion of the number of SNPs showing opposite directional β-values was calculated. (Note: This analysis was focused not only on top-eQTL-SNPs but on all SNPs showing significant eQTL signals. SNPs that are not significant in both tissues of the pair were omitted from the analysis.) Clustering the tissue types based on the opposite eQTL effect fractions was conducted by the R software (version 3.3.0).
Distribution analysis of the distance from TSS
Distance from TSS was retrieved from the GTEx database for all SNPs in each type of gene and SNP pairs (eQTL-Gene and SNP with any eQTL signal, eQTL-Gene and top-eQTL-SNP, multi-eQTL-Gene and multi-eQTL-SNP, opp-multi-eQTL-Gene and opp-multi-eQTL-SNP). A subset of the multi-eQTL-Gene and multi-eQTL-SNP pairs was randomly sampled so that the null distribution of the number of tissues in which a significant eQTL signal of the same gene and SNP pair was detected (i.e., the number of sharing tissues) was adjusted between the multi-eQTL-SNPs and the opp-multi-eQTL-SNPs. The density distribution of the distance from TSS for each type of SNPs was analyzed by the R software (version 3.3.0). The significance level of the TSS enrichment in the opp-multi-eQTL-SNPs compared to the adjusted multi-eQTL-SNPs was evaluated based on kurtosis of the density distribution by 10,000-time random sampling.
Epigenetic annotation analysis on histone modification and DNase sensitivity
To adjust the distance from TSS, a subset of the multi-eQTL-SNPs (TSS-distance-adjusted multi-eQTL-SNPs) was generated by random sampling so that the null distribution of the distance form TSS was matched with that of the opp-multi-eQTL-SNPs. Specifically, the opp-multi-eQTL-Gene and opp-multi-eQTL-SNP pairs in each 1-kbp window from −1000 to +1000 kbp TSS distance were counted, and the same number of pairs were randomly sampled from the multi-eQTL-Gene and multi-eQTL-SNP pairs for each window to generate the adjusted dataset of multi-eQTL-SNPs. The SNP annotation dataset was downloaded from the HaploReg v4.1 website (accessed 2019/02/01; file name: haploreg_v4.0_20151021.vcf.gz; https://pubs.broadinstitute.org/mammals/haploreg/data/) [19], which includes epigenetic annotations from the Roadmap Epigenomics project on up to 127 cell lines [6]. The annotations were histone modification states (H3K4me1, H3K4me3, H3K9ac, and H3K27ac) and sensitivity to cleavage by DNase. For enrichment analysis of these epigenetic annotations, the fraction of SNPs with each epigenetic annotation in each type of SNPs (multi-eQTL-SNPs, TSS-distance-adjusted multi-eQTL-SNPs, or opp-multi-eQTL-SNPs) was calculated for each of the cell lines in which the epigenetic annotation data were available. The mean fraction across the available cell lines was used as a surrogate to investigate the enrichment. The random generation of the TSS-distance-adjusted multi-eQTL-SNPs was repeated by 10,000 times to provide 95% confidence interval.
Assessment of LD relationship with the SNPs reported in the GWAS catalog
The summary information about SNPs reported in GWASs (GWAS-SNPs) was downloaded from the GWAS catalog website (accessed 2019/03/06; file name: gwas_catalog_v1.0.2-associations_e93_r2019-01-31.tsv; https://www.ebi.ac.uk/gwas/) [16], and SNPs whose reported p-value is less than 5 × 10⁻⁸ were extracted. For each type of SNPs in the GTEx database (SNPs with any eQTL signals, top-eQTL-SNPs, multi-eQTL-SNPs, TSS-distance-adjusted multi-eQTL-SNPs, and opp-multi-eQTL-SNPs), the r2 coefficient of the LD with the GWAS-SNPs was calculated by PLINK 1.9 using 1000 genomes project phase 3 data version 5 (EUR population) as the reference. The number of SNPs whose r2 coefficient was more than 0.8 with at least one GWAS-SNP was counted. The significance level of the percentage of SNPs in LD with the GWAS-SNPs in the opp-multi-eQTL-SNPs was investigated by Fisher’s exact test (compared to the multi-eQTL-SNPs) and 10,000-time random sampling (compared to the TSS-distance-adjusted multi-eQTL-SNPs). Some examples of the opp-multi-eQTL-SNPs that showed the LD with the GWAS-SNP(s) were chosen, and the distribution of the β-value and negative logarithm of p-value of all tested SNPs within 1 Mbp distance from TSS with respect to the position on chromosome were plotted by the R software (version 3.3.0). The β-value and p-value of all tested SNPs including SNPs that showed non-significant eQTL signals were downloaded from the GTEx portal site (release version 7, file name: GTEx_Analysis_v7_eQTL_all_associations.tar.gz; https://www.gtexportal.org/). For clarification of the directional difference of the eQTL effects between tissues, reference and alternative alleles were reassigned so that the signs of β-values of all tested SNPs are all positive in one of the tissues of the pair. In the other tissue, the β-values were plotted according to the reassigned reference and alternative alleles.
Results
Grouping genes and SNPs for analysis of the opposite eQTL effects
From the GTEx database (release version 7), genes and SNPs relating to the opposite eQTL effects between different tissues were extracted stepwise, the graphical scheme of which is depicted in Fig. 1 (see Materials and methods for details). Briefly, when one or more SNPs showed an eQTL signal on the expression of a gene in either tissue, the affected gene was denoted as eQTL-Gene, and the SNP showing the most significant eQTL signal was denoted as top-eQTL-SNP. Focusing on an eQTL-Gene in a given tissue pair (tissue X and tissue Y in Fig. 1), if the two top-eQTL-SNPs are identical or in LD (r2 > 0.8), the top-eQTL-SNPs and the eQTL-Gene were designated as multi-eQTL-SNPs and multi-eQTL-Gene, respectively. Subsequently, if the expression effects of the multi-eQTL-SNPs on the multi-eQTL-Gene are in the opposite direction between tissue X and tissue Y, the multi-eQTL-SNPs and multi-eQTL-Gene were highlighted as opp-multi-eQTL-SNPs and opp-multi-eQTL-Gene, respectively. If the opposite direction of expression effects was detected in at least one tissue pair, the genes and SNPs were considered to be associated with the opposite eQTL effects.

Graphical scheme for extraction of the genes and SNPs associated with opposite eQTL effects between different tissues. In each tissue, genes that have at least one SNP with a significant eQTL signal are denoted as eQTL-Genes, and for each eQTL-Gene, the SNP with the most significant eQTL signal is designated as top-eQTL-SNP. In a tissue pair (i.e., tissue X and tissue Y in the figure), if the linkage disequilibrium (LD) coefficient (r2) between the top-eQTL-SNPs is more than 0.8, the top-eQTL-SNPs and eQTL-Gene are denoted as multi-eQTL-SNPs and multi-eQTL-Gene, respectively. Subsequently, the direction of the effect sizes of the multi-eQTL-SNPs are compared in the tissue pair, and if the effects are in the opposite direction, the multi-eQTL-SNPs and multi-eQTL-Gene are highlighted as opp-multi-eQTL-SNPs and opp-multi-eQTL-Gene, respectively. All tissue pairs in the GTEx database release version 7 (1128 pairs from 48 tissues) are examined to extract the opp-multi-eQTL-SNPs and opp-multi-eQTL-Genes
Overall results of extracting each type of gene/SNP pairs from 48 tissues in the GTEx database are summarized in Table 1. The opp-multi-eQTL-Genes accounted for 7.4% of the eQTL-Genes (2,323 out of 31,212 eQTL-Genes), and the opp-multi-eQTL-SNPs accounted for 4.4% of the top-eQTL-SNPs (9,290 out of 210,878 top-eQTL-SNPs). The proportion of the opp-multi-eQTL-Genes was unexpectedly high when compared to those in the previous eQTL studies, in which a few proportions (approximately 1.4% of gene probes) showed opposite effect sizes between blood and four non-blood tissues [12]. This increase could be mainly due to the large number of tissue types in the GTEx database, which provided combinatorial increase of the tissue pairs to assess the discordance of eQTL effects, giving high chance to discover SNPs with the opposite eQTL effects. Based on this result, the existence of the opposite eQTL effects might have been underestimated, and the more tissue types are analyzed, the more opposite eQTL effects can be discovered.
The distribution of significance levels of the opposite eQTL effects were also investigated based on the p-values in each tissue pair where multi-eQTL-SNPs or opp-multi-eQTL-SNPs were detected. Since there are two p-values from the two tissues of a pair, p-value_1 was designated as the lower one, and p-value_2 was designated as the higher one. The distribution of negative logarithm of p-value_1 and 2 is shown in Supplementary Fig. S2. The difference between the 2D density maps of multi-eQTL-SNPs and opp-multi-eQTL-SNPs is also shown. The density in the opp-multi-eQTL-SNPs is high along the horizontal axis and low in the diagonal area compared to the density in the multi-eQTL-SNPs. Therefore, the significance levels of the top eQTL effects tend to deviate more largely between the two tissues of the pair that showed opposite eQTL effects. This finding could be understandable based on the possibility that the opposite eQTL effects resulted from altered gene regulation patterns depending on tissue types, the statistical detection level of which would largely vary across tissues.
Tissue-dependent characteristics of the opposite eQTL effects
The number of eQTL-Genes, multi-eQTL-Genes, and opp-multi-eQTL-Genes for each tissue are shown in Fig. 2A–C. The tissues are shown by abbreviations and categorized by the organ systems (Supplementary Table S2). The number of each type of genes varied in different tissues (coefficient of variation (CV) = 0.48–0.60). This variation was mainly caused by the difference of the sample sizes obtained for each tissue, because the number of identified eQTL-Genes in a tissue increases linearly with its sample size [20]. To remove the sample size bias, the proportion of the multi-eQTL-Genes (=multi-eQTL-Genes/eQTL-Genes) and opp-multi-eQTL-Genes (=opp-multi-eQTL-Genes/eQTL-Genes and opp-multi-eQTL-Genes/multi-eQTL-Genes) were calculated and shown in Fig. 2D–F. There was negative correlation between the proportion of multi-eQTL-Genes and that of opp-multi-eQTL-Genes (Pearson’s correlation coefficient r = −0.54 between multi-eQTL-Genes/eQTL-Genes (D) and opp-multi-eQTL-Genes/eQTL-Genes (E), and r = −0.81 between multi-eQTL-Genes/eQTL-Genes (D) and opp-multi-eQTL-Genes/multi-eQTL-Genes (F)).

Counts and proportions of eQTL-, multi-eQTL-, and opp-multi-eQTL-Genes for 48 tissues in the GTEx database (release version 7). A Counts of eQTL-Genes. B Counts of multi-eQTL-Genes. C Counts of opp-multi-eQTL-Genes. D Proportion (%) of multi-eQTL-Genes in eQTL-Genes. E Proportion (%) of opp-multi-eQTL-Genes in eQTL-Genes. F Proportion (%) of opp-multi-eQTL-Genes in multi-eQTL-Genes. CV stands for coefficient of variation
Since the multi-eQTL-Genes are the genes whose most significant eQTL is shared by multiple tissues, the index of multi-eQTL-Genes/eQTL-Genes could be interpreted as the similarity of the gene regulation pattern among the tissues. Therefore, its negatively correlated index, opp-multi-eQTL-Genes/(multi-)eQTL-Genes, could indicate the difference of the gene regulation pattern compared to the other tissues. In addition, the opp-multi-eQTL-Genes/(multi-)eQTL-Genes can be used as a sensitive index to catch the gene regulation uniqueness, because the CV of opp-multi-eQTL-Genes/(multi-)eQTL-Genes (0.22 and 0.32) was larger than that of multi-eQTL-Genes/eQTL-Genes (0.09). Testis showed the smallest value of multi-eQTL-Genes/eQTL-Genes (38.1%) and the highest value of opp-multi-eQTL-Genes/multi-eQTL-Genes (13.7%), which would be reasonable because testis clearly showed different gene expression pattern, e.g., testis expressed the largest number of genes and many of them were uniquely expressed. Following to testis, high value of opp-multi-eQTL-Genes/multi-eQTL-Genes was detected for cerebellar tissues (BRNCHB; 8.1% and BRNCHA; 8.3%), blood cells (LCL; 8.7% and WHLBLD; 10.8%), fibroblasts (FIBRBLS; 7.9%), skeletal muscle (MSCLSK; 8.9%), and some gastrointestinal tissues (ESPMCS; 7.5%, LIVER; 8.3%, and PNCREAS; 7.2%).
For each tissue pair in the 48 tissues (1128 pairs in total), the SNPs that showed eQTL signals in both tissues of the pair were plotted with respect to the β-value. The summary of the proportion of the SNPs showing the opposite directional β-values in the tissue pair is shown by heatmap in Fig. 3. Two representative plots are shown for (A) visceral adipose (ADPVSC) vs. breast (BREAST), in which no opposite eQTL effects were detected, and for (B) whole blood (WHLBLD) vs. testis (TESTIS), in which the largest proportion of the SNPs with opposite directional β-values (10.7%) was detected. As expected, testis showed high intensity of the opposite eQTL effects against almost all other tissues. Based on the averaged proportions between the organ system categories (Supplementary Table S3), the tissues in the same organ system category had a tendency to show relatively low intensity of the opposite eQTL effects, as remarkably shown in the brain tissues. In accordance with the results in Fig. 2, the cerebellar tissues showed clearly different intensity compared to the other brain tissues, which might indicate the well-documented, different gene expression pattern of cerebellum from other parts of the brain [21, 22].

Heatmap of the proportion of SNPs showing opposite directional β-values. For each tissue pair, SNPs showing significant eQTL signals in both tissues were extracted. Direction of the β-values (effect sizes) of the SNPs was compared in each tissue pair, and proportion (%) of the SNPs that showed opposite directional β-values is shown by heatmap with the color scale shown on the top (blue to red). Plots of β-values of the SNPs in the two representative tissue pairs are shown on the bottom: A visceral adipose (ADPVSC) vs. breast (BREAST) and B whole blood (WHLBLD) vs. testis (TESTIS). SNPs with the same directional β-values are indicated as blue points, and SNPs with the opposite directional β-values are indicated as red points. There were no opposite eQTL effects found between ADPVSC and BREAST, while the largest proportion (10.7%) of the opposite eQTL effects were detected between WHLBLD and TESTIS
Based on the proportions of SNPs showing opposite directional β-values, clustering analysis of the 48 tissue types was further performed. The result was depicted by heatmap in Supplementary Fig. S3. The brain tissues were well clustered with the cerebellar tissues apart as expected from Fig. 3. Although most of the organ system categories that we assigned for this study were not reproduced as a single cluster, some closely related tissue types were located in close positions such as LCL-WHLBLD, UTERUS-VAGINA, and LIVER-PNCREAS. Liver and pancreas both arise from the foregut endoderm in the embryonic development and possibly share a common progenitor population [23], whose common gene regulation pattern might be related to the similar opposite eQTL effect fractions against other tissue types.
Biological properties of SNPs with the opposite eQTL effects
The distribution of the distance from TSS in each type of SNPs (SNPs with any eQTL signal, top-eQTL-SNPs, multi-eQTL-SNPs, and opp-multi-eQTL-SNPs) is shown in Fig. 4. The distribution of the top-eQTL-SNPs was enriched at the TSS compared to all SNPs with any eQTL signal, which is in accordance with the common knowledge of eQTLs that the statistical significance of eQTLs becomes higher when it is close to the TSS [24,25,26]. The distribution of the multi-eQTL-SNPs was more enriched at the TSS than that of the top-eQTL-SNPs. This is also in consistence with another report on eQTLs using multiple types of tissues, in which the eQTLs shared by multiple tissues were located closer to the TSS than the eQTLs uniquely detected in a single tissue [27]. Interestingly, even more enrichment at the TSS was observed with the opp-multi-eQTL-SNPs (density ratio at TSS = 1.4 between multi-eQTL-SNPs and opp-multi-eQTL-SNPs). There could be a possibility that this enrichment at the TSS was plausibly caused by the increase of the number of sharing tissues rather than the opposite eQTL effects. To reject this hypothesis, the multi-eQTL-SNPs were thus randomly subsampled so that the number of sharing tissues was adjusted with that of the opp-multi-eQTL-SNPs. The distribution of the adjusted multi-eQTL-SNPs showed significantly less enrichment at the TSS compared to the opp-multi-eQTL-SNPs (p < 1.0 × 10⁻⁴), while it was not significantly different from that of the multi-eQTL-SNPs.
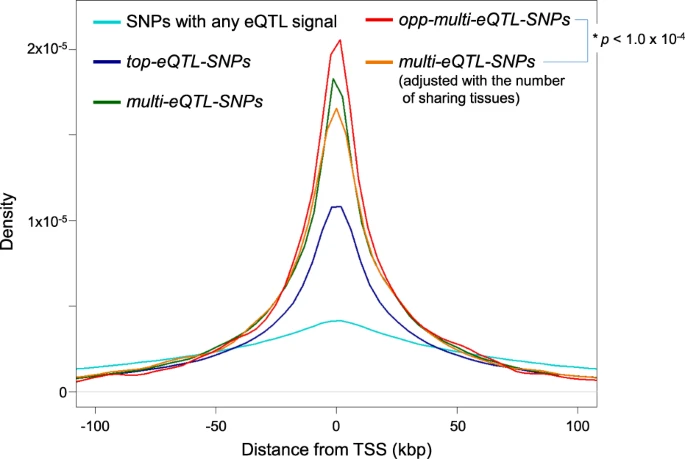
Distribution of the distance from TSS in each type of SNPs. For each type of SNPs (SNPs with any eQTL signal, top-eQTL-, multi-eQTL-, and opp-multi-eQTL-SNPs), the distribution of the distance from TSS is shown (in light blue, dark blue, green, and red, respectively). To adjust the number of sharing tissues of multi-eQTL-SNPs to that of opp-multi-eQTL-SNPs, subset of the multi-eQTL-SNPs was also analyzed, which is shown in an orange line. The TSS enrichment was evaluated on kurtosis of the density plot, and its significance level in opp-multi-eQTL-SNPs compared to adjusted multi-eQTL-SNPs was p < 1.0 × 10⁻⁴, which was determined by 10,000-time random sampling
The opposite eQTL effects could be caused by epigenetically altered gene regulation patterns between tissues. To investigate a possible participation of epigenetic factors, we referred to histone modification (H3K4me1, H3K4me3, H3K9ac, and H3K27ac) and DNase sensitivity annotation data from the Roadmap Epigenomics project on up to 127 different cell lines [6], which are included in the HaploReg dataset [19]. For each cell line, the fractions of SNPs with each epigenetic annotation were calculated for multi-eQTL-SNPs and opp-multi-eQTL-SNPs. Since the enrichment at TSS in the opp-multi-eQTL-SNPs can be a confounding factor, the fractions were also calculated for a subset of the multi-eQTL-SNPs (TSS-distance-adjusted multi-eQTL-SNPs), which was generated by random subsampling so that the null distribution of the TSS distance was matched with that of the opp-multi-eQTL-SNPs. As shown in Supplementary Table S4, the mean fractions across cell lines were small in multi-eQTL-SNPs and large in opp-multi-eQTL-SNPs in all of the epigenetic annotations, which were statistically significant (p < 0.05) compared to the fractions in the TSS-distance-adjusted multi-eQTL-SNPs. Therefore, the epigenetic annotation enrichment can be related not only to the locational enrichment at TSS, but also to the opposite eQTL effects, which might be a molecular basis to regulate gene expression in the opposite directions between tissues.
Association of opposite eQTL effects with complex traits
Based on the above analyses, the opp-multi-eQTL-SNPs showed relationship with the difference of the gene regulation pattern among tissues, according to the proximity in the distance from TSS and the possible involvement of epigenetic factors. To further evaluate the biological importance of the opposite eQTL effects, the LD relationship between each type of eQTL SNPs and the complex trait-associated SNPs reported in the GWAS catalog (GWAS-SNPs) was assessed. As summarized in Table 2, the proportion of the eQTL SNPs in LD with the GWAS-SNPs (r2 > 0.8) increased in the order of SNPs with any eQTL signal, top-eQTL-SNPs, multi-eQTL-SNPs, and opp-multi-eQTL-SNPs. Surprisingly, one out of four opp-multi-eQTL-SNPs (2,498 out of 9,290; 26.9%) was in LD with the GWAS-SNPs.
The enrichment with the GWAS-SNPs could be caused because the location of the SNPs was enriched at the TSS as reported in other studies [28, 29], rather than because the SNPs showed the opposite eQTL effects. To reject this possibility, the same analysis was conducted on the TSS-distance-adjusted multi-eQTL-SNPs. As a result, the proportion of the SNPs in LD with the GWAS-SNPs was not significantly different between the adjusted and non-adjusted multi-eQTL-SNPs (20.5% vs. 20.2%), while the proportion in the opp-multi-eQTL-SNPs was significantly higher than that in the adjusted multi-eQTL-SNPs (p < 1.0 × 10⁻⁴). These support that the enrichment of the GWAS-SNPs in the opp-multi-eQTL-SNPs was attributed to their own functional effects rather than the distance from the TSS. Since replication tendency of SNPs could be another confounding factor (i.e., opp-multi-eQTL-SNPs might be more likely to replicate in eQTL studies), we investigated the replication rates of TSS-distance-adjusted multi-eQTL-SNPs and opp-multi-eQTL-SNPs in other 12 independent eQTL datasets (Supplementary Table S5); however, there was no clear replication difference, i.e., while six datasets favored opp-multi-eQTL-SNPs, the other six ones favored TSS-distance-adjusted multi-eQTL-SNPs. Although not all confounding factors were excluded, the opposite eQTL effects could be a factor underlying the development of complex traits in GWASs.
Examples of the distribution of β-value and p-value of the GWAS-related opp-multi-eQTL-SNPs with respect to the position on chromosome are shown in Fig. 5. The opposite eQTL effects on d-dopachrome tautomerase gene (DDT [MIM: 602750]) between blood and liver tissues was previously reported [12]. The same opposite eQTL effects were recapitulated in this study, and also some other tissues such as skeletal muscle (MSCLSK) showed the opposite direction of eQTL effects as shown in Fig. 5A, in which the opp-multi-eQTL-SNPs (rs5760120 and rs5760119) was in LD with rs2739330, reported in the association study of the liver enzyme level trait [30].

Distribution of the β-value and p-value of GWAS-related SNPs with opposite eQTL effects. The opp-multi-eQTL-SNPs that are in LD (r2 > 0.8) with the GWAS-SNPs were extracted, and examples of the genes affected by such GWAS-related opp-multi-eQTL-SNPs were selected. Distribution of β-value (y-axis) and negative logarithm of p-value (color scale) of all tested SNPs within 1 Mbp distance from TSS of the selected gene is shown with respect to the position on chromosome. A d-Dopachrome tautomerase gene (DDT [MIM: 602750]). Plots for skeletal muscle (MSCLSK) and liver (LIVER) are shown in red and blue, respectively. B Pleckstrin homology and RUN domain containing M1 gene (PLEKHM1 [MIM: 611466]). Plots for cerebellum (BRNCHA) and brain cortex (BRNCTXA) are shown in red and blue, respectively
As discussed above, the cerebellar tissues showed more opposite eQTL effects than other parts of the brain. Interestingly, there were GWAS-related opposite eQTL effects detected between the cerebellar tissues and other brain tissues. An example of such cases is shown in Fig. 5B, in which the SNPs showed opposite eQTL effects on pleckstrin homology and RUN domain containing M1 gene (PLEKHM1 [MIM: 611466]) between cerebellum (BRNCHA) and brain cortex (BRNCTXA). The identified opp-multi-eQTL-SNPs (rs1991556 and rs112411928) were in LD with the SNPs reported in neurological diseases such as Parkinson disease (PD [MIM: 168600]) [31,32,33], progressive supranuclear palsy ([MIM: 601104]) [34], and corticobasal degeneration [35]. The susceptibility difference between brain regions including cerebellum found in those diseases could be related to the difference of the gene regulation pattern, which might have been detected as the opposite eQTL effects in this study.
Discussion
The largest eQTL database from the GTEx project provided an ideal dataset to analyze the opposite eQTL effects between tissues, resulting in several findings to be noted. First, the analysis of the diverse tissue pairs revealed that the genes affected by the opposite eQTL effects (opp-multi-eQTL-Genes) can be discovered more frequently than expected from previous eQTL studies (Table 1). Second, the statistics of the opposite eQTL effects suggested that the indices relating to the opp-multi-eQTL-Genes and SNPs (i.e., the proportion of opp-multi-eQTL-Genes in multi-eQTL-Genes shown in Fig. 2, and the proportion of SNPs with opposite directional β-values shown in Fig. 3) could be used as an indicator of the different gene regulation pattern compared to other tissues in a study. Finally, the enrichment analysis of the opp-multi-eQTL-SNPs about the distance from TSS, the epigenetic annotations, and the GWAS-SNPs showed their possible involvement in altered gene regulation depending on tissue types and association with the complex traits in GWASs (Fig. 4, Table S4, and Table 2), which supported the importance of the opposite eQTL effects as the biologically meaningful annotations of genes and genetic variants.
In this study, the summary statistics-based analysis method evaluated the discordance of eQTL effects between different tissues by comparing the direction of the primary, or most significant, eQTL signals with the LD relationship taken into account. Our method might have effectively worked to remove less meaningful opposite eQTL effects. As an example in Supplementary Fig. S4, the eQTL effects on solute carrier family 37 member 1 gene (SLC37A1 [MIM: 608094]) can be considered to be in the opposite direction between pituitary (PTTARY) and skeletal muscle (MSCLSK), if the discordance is evaluated by all (including secondary) eQTL signals or by the primary eQTL signals without LD calculation. In this case, the top-eQTL-SNPs in the two tissues (rs4919992 for PTTARY and rs228048 for MSCLSK) are localized in the different LD blocks (i.e., r2 < 0.8). rs228048 was significant only in MSCLSK, while rs4919992 showed significant eQTL signals in both tissues. However, rs4919992 apparently composes the secondary marginal eQTL signals in MSCLSK, which are independent from the primary eQTL signals tagged by rs228048. This kind of discordance would be less meaningful to describe the gene regulation difference between the tissues, compared to the discordance detected between the top-eQTL-SNPs in LD. Consistently, rs4919992 and rs228048 did not show the LD relationship with the GWAS-SNPs. The hit rate of GWAS-SNPs in the opp-multi-eQTL-SNPs was 26.9% (Table 2), but it significantly dropped to 20.7% when no LD threshold was set to define the opp-multi-eQTL-SNPs, which supports that the LD evaluation of the primary eQTLs in this study was effective for assessing the discordance of eQTL effects between tissues.
In conclusion, as the tissue-dependent discordant eQTL effects, the opposite eQTL effects were discovered for the significant proportion of the eQTL-Genes in the GTEx database (2,323 out of 31,212; 7.4%). Such opposite eQTL effects were shown to be associated with the complex traits in GWASs. Based on these analyses, it appears that the frequency of the opposite eQTL effects has been underestimated, and they would be a rather common phenomenon, which possibly play an important role in the tissue-specific gene regulation influencing the development of complex traits. Therefore, the association with the opposite eQTL effects can be a biologically meaningful annotation of genes and genetic variants to further understand the results of GWASs. Although the GTEx database is currently the largest eQTL database, it is not yet a complete dataset for all tissues in human, and the diversity of the populations is also limited. Since this study was based on the eQTL results analyzed for each single tissue, meta-analysis of eQTL effects across tissue types could be useful to discover true opposite eQTL effects in the multi-tissue dataset [36]. As the future perspective, incorporating other tissue types such as immune cells and developing a meta-analysis method suitable for multi-tissue eQTL studies will be important for the purpose of revealing the whole image of the opposite eQTL effects and their contribution to the genetics of complex traits.
Web resources
GTEx Portal: https://www.gtexportal.org/
GWAS Catalog: https://www.ebi.ac.uk/gwas/
1000 Genomes Project: http://www.internationalgenome.org/
PLINK 1.9: https://www.cog-genomics.org/plink2
HaploReg v4.1: https://pubs.broadinstitute.org/mammals/haploreg/haploreg.php
References
Visscher PM, Wray NR, Zhang Q, Sklar P, McCarthy MI, Brown MA, et al. 10 Years of GWAS discovery: biology, function, and translation. Am J Hum Genet. 2017;101:5–22.
Lowe WL, Reddy TE. Genomic approaches for understanding the genetics of complex disease. Genome Res. 2015;25:1432–41.
Gallagher MD, Chen-Plotkin AS. The post-GWAS era: from association to function. Am J Hum Genet. 2018;102:717–30.
Andersson R, Gebhard C, Miguel-Escalada I, Hoof I, Bornholdt J, Boyd M, et al. An atlas of active enhancers across human cell types and tissues. Nature. 2014;507:455–61.
Kellis M, Wold B, Snyder MP, Bernstein BE, Kundaje A, Marinov GK, et al. Defining functional DNA elements in the human genome. Proc Natl Acad Sci USA. 2014;111:6131–8.
Roadmap Epigenomics Consortium, Kundaje A, Meuleman W, Ernst J, Bilenky M, Yen A, et al. Integrative analysis of 111 reference human epigenomes. Nature. 2015;518:317–30.
Dekker J, Belmont AS, Guttman M, Leshyk VO, Lis JT.Lomvardas S, et al. The 4D Nucleome Network. The 4D nucleome project. Nature. 2017;549:219–26.
GTEx Consortium. The Genotype-Tissue Expression (GTEx) project. Nat Genet. 2013;45:580–5.
GTEx Consortium. Genetic effects on gene expression across human tissues. Nature. 2017;550:204–13.
Fagny M, Paulson JN, Kuijjer ML, Sonawane AR, Chen C-Y, Lopes-Ramos CM, et al. Exploring regulation in tissues with eQTL networks. Proc Natl Acad Sci USA. 2017;114:E7841–E7850.
Ongen H, Brown AA, Delaneau O, Panousis NI, Nica AC, GTEx Consortium, Dermitzakis ET. Estimating the causal tissues for complex traits and diseases. Nat Genet. 2017;49:1676–83.
Fu J, Wolfs MG, Deelen P, Westra H-J, Fehrmann RS, Te Meerman GJ, et al. Unraveling the regulatory mechanisms underlying tissue-dependent genetic variation of gene expression. PLoS Genet. 2012;8:e1002431.
Thabet K, Asimakopoulos A, Shojaei M, Romero-Gomez M, Mangia A, Irving WL, et al. International Liver Disease Genetics Consortium. MBOAT7 rs641738 increases risk of liver inflammation and transition to fibrosis in chronic hepatitis C. Nat Commun. 2016;7:12757.
Ishigaki K, Kochi Y, Suzuki A, Tsuchida Y, Tsuchiya H, Sumitomo S, et al. Polygenic burdens on cell-specific pathways underlie the risk of rheumatoid arthritis. Nat Genet. 2017;49:1120–5.
Strunz T, Grassmann F, Gayán J, Nahkuri S, Souza-Costa D, Maugeais C, et al. A mega-analysis of expression quantitative trait loci (eQTL) provides insight into the regulatory architecture of gene expression variation in liver. Sci Rep. 2018;8:5865.
MacArthur J, Bowler E, Cerezo M, Gil L, Hall P, Hastings E, et al. The new NHGRI-EBI Catalog of published genome-wide association studies (GWAS Catalog). Nucleic Acids Res. 2017;45:D896–D901.
1000 Genomes Project Consortium. A global reference for human genetic variation. Nature. 2015;526:68–74.
Chang CC, Chow CC, Tellier LC, Vattikuti S, Purcell SM, Lee JJ. Second-generation PLINK: rising to the challenge of larger and richer datasets. GigaScience. 2015;4:7.
Ward LD, Kellis M. HaploReg: a resource for exploring chromatin states, conservation, and regulatory motif alterations within sets of genetically linked variants. Nucleic Acids Res. 2012;40:D930–D934.
GTEx Consortium. The Genotype-Tissue Expression (GTEx) pilot analysis: multitissue gene regulation in humans. Science. 2015;348:648–60.
Khaitovich P, Muetzel B, She X, Lachmann M, Hellmann I, Dietzsch J, et al. Regional patterns of gene expression in human and chimpanzee brains. Genome Res. 2004;14:1462–73.
Negi SK, Guda C. Global gene expression profiling of healthy human brain and its application in studying neurological disorders. Sci Rep. 2017;7:897.
Zaret KS, Grompe M. Generation and regeneration of cells of the liver and pancreas. Science. 2008;322:1490–4.
Zhang X, Gierman HJ, Levy D, Plump A, Dobrin R, Goring HH, et al. Synthesis of 53 tissue and cell line expression QTL datasets reveals master eQTLs. BMC Genomics. 2014;15:532.
Wen X, Luca F, Pique-Regi R. Cross-population joint analysis of eQTLs: fine mapping and functional annotation. PLoS Genet. 2015;11:e1005176.
Mehta D, Heim K, Herder C, Carstensen M, Eckstein G, Schurmann C, et al. Impact of common regulatory single-nucleotide variants on gene expression profiles in whole blood. Eur J Hum Genet. 2012;21:48–54.
Ongen H, Andersen CL, Bramsen JB, Oster B, Rasmussen MH, Ferreira PG, et al. Putative cis-regulatory drivers in colorectal cancer. Nature. 2014;512:87–90.
Walsh AM, Whitaker JW, Huang CC, Cherkas Y, Lamberth SL, Brodmerkel C, et al. Integrative genomic deconvolution of rheumatoid arthritis GWAS loci into gene and cell type associations. Genome Biol. 2016;17:79.
Sniekers S, Stringer S, Watanabe K, Jansen PR, Coleman JRI, Krapohl E, et al. Genome-wide association meta-analysis of 78,308 individuals identifies new loci and genes influencing human intelligence. Nat Genet. 2017;49:1107–12.
Chambers JC, Zhang W, Sehmi J, Li X, Wass MN, van der Harst P, et al. Genome-wide association study identifies loci influencing concentrations of liver enzymes in plasma. Nat Genet. 2011;43:1131–8.
Simón-Sánchez J, Schulte C, Bras JM, Sharma M, Gibbs JR, Berg D, et al. Genome-wide association study reveals genetic risk underlying Parkinson’s disease. Nat Genet. 2009;41:1308–12.
International Parkinson Disease Genomics Consortium, Nalls MA, Plagnol V, Hernandez DG, Sharma M, Sheerin U-M, et al. Imputation of sequence variants for identification of genetic risks for Parkinson’s disease: a meta-analysis of genome-wide association studies. Lancet. 2011;377:641–9.
Chang D, Nalls MA, Hallgrímsdóttir IB, Hunkapiller J, van der Brug M, Cai F, International Parkinson’s Disease Genomics Consortium, 23andMe Research Team. et al. A meta-analysis of genome-wide association studies identifies 17 new Parkinson’s disease risk loci. Nat Genet. 2017;49:1511–6.
Höglinger GU, Melhem NM, Dickson DW, Sleiman PM, Wang L-S, Klei L, et al. Identification of common variants influencing risk of the tauopathy progressive supranuclear palsy. Nat Genet. 2011;43:699–705.
Kouri N, Ross OA, Dombroski B, Younkin CS, Serie D, Soto-Ortolaza A, et al. Genome-wide association study of corticobasal degeneration identifies risk variants shared with progressive supranuclear palsy. Nat Commun. 2015;6:7247.
Urbut SM, Wang G, Carbonetto P, Stephens M. Flexible statistical methods for estimating and testing effects in genomic studies with multiple conditions. Nat Genet. 2019;51:187–95.
Acknowledgements
This study was supported by the Japan Society for the Promotion of Science (JSPS) KAKENHI (15H05911, 19H01021), the Japan Agency for Medical Research and Development (AMED; 19gm6010001h0004, 19ek0410041h0003, and 19ek0109413h0001), Takeda Science Foundation, Bioinformatics Initiative of Osaka University Graduate School of Medicine, Osaka University, and Integrated Frontier Research for Medical Science Division, Institute for Open and Transdisciplinary Research Initiatives, Osaka University, and Osaka University Medical Doctor Scientist Training Program.
Author information
Authors and Affiliations
Corresponding author
Ethics declarations
Conflict of interest
The authors declare that they have no conflict of interest.
Additional information
Publisher’s note: Springer Nature remains neutral with regard to jurisdictional claims in published maps and institutional affiliations.
Supplementary information
Rights and permissions
Open Access This article is licensed under a Creative Commons Attribution 4.0 International License, which permits use, sharing, adaptation, distribution and reproduction in any medium or format, as long as you give appropriate credit to the original author(s) and the source, provide a link to the Creative Commons license, and indicate if changes were made. The images or other third party material in this article are included in the article’s Creative Commons license, unless indicated otherwise in a credit line to the material. If material is not included in the article’s Creative Commons license and your intended use is not permitted by statutory regulation or exceeds the permitted use, you will need to obtain permission directly from the copyright holder. To view a copy of this license, visit http://creativecommons.org/licenses/by/4.0/.
About this article

Cite this article
Mizuno, A., Okada, Y. Biological characterization of expression quantitative trait loci (eQTLs) showing tissue-specific opposite directional effects. Eur J Hum Genet 27, 1745–1756 (2019). https://doi.org/10.1038/s41431-019-0468-4
Received:
Revised:
Accepted:
Published:
Issue Date:
DOI: https://doi.org/10.1038/s41431-019-0468-4
This article is cited by
-
TBK1, a prioritized drug repurposing target for amyotrophic lateral sclerosis: evidence from druggable genome Mendelian randomization and pharmacological verification in vitro
BMC Medicine (2024)
-
Whole-body adipose tissue multi-omic analyses in sheep reveal molecular mechanisms underlying local adaptation to extreme environments
Communications Biology (2023)
-
Mendelian randomization and genetic colocalization infer the effects of the multi-tissue proteome on 211 complex disease-related phenotypes
Genome Medicine (2022)
-
Protein arginine N-methyltransferase 1 gene polymorphism is associated with proliferative diabetic retinopathy in a Japanese population
Acta Diabetologica (2022)
-
Integration of genetic, transcriptomic, and clinical data provides insight into 16p11.2 and 22q11.2 CNV genes
Genome Medicine (2021)
