
Abstract
We describe Targeting-Induced Local Lesions IN Genomes (TILLING), a reverse-genetic strategy for the discovery and mapping of induced mutations. TILLING is suitable for essentially any organism that can be mutagenized. The TILLING procedure has also been adapted for the discovery and cataloguing of natural polymorphisms, a method called Ecotilling. To discover nucleotide changes within a particular gene, PCR is performed with gene-specific primers that are end-labeled with fluorescent molecules. After PCR, samples are denatured and annealed to form heteroduplexes between polymorphic DNA strands. Mismatched base pairs in these heteroduplexes are cleaved by digestion with a single-strand specific nuclease. The resulting products are size-fractionated using denaturing polyacrylamide gel electrophoresis and visualized by fluorescence detection. The migration of cleaved products indicates the approximate location of nucleotide polymorphisms. Throughput is increased and costs are reduced by sample pooling, multi-well liquid handling and automated gel band mapping. Once genomic DNA samples have been obtained, pooled and arrayed, thousands of samples can be screened daily.
Introduction
The acquisition of large-scale nucleotide sequence data has led to the introduction of methods that target the disruption of specific genes, also known as reverse genetics. Although potentially very powerful, reverse genetic approaches can be limited if the method used to induce the genetic change is not generally applicable to different organisms, as is often the case for transgenic strategies. However, chemicals and other agents have been used for several decades to induce mutations in a variety of organisms, making traditional mutagenesis an attractive strategy for reverse genetics. Chemical mutagenesis is especially valuable for agricultural applications because, unlike transgenic approaches, it is not hampered by restrictive regulatory and consumer issues. In addition, mutagenesis-based methods for reverse genetic applications can provide more than just gene knockouts; mutagens such as ethyl methanesulfonate primarily induce point mutations, providing allelic series that also include useful missense mutations1. Mutations can be induced by chemicals at a high density, allowing for the efficient recovery of multiple alleles in a small screening population. TILLING is a reverse genetic strategy that combines traditional mutagenesis with high-throughput discovery of single-nucleotide changes2,3. The method is general and, following its original application to the model plant Arabidopsis thaliana, has been applied to a variety of plant and animal species including maize, lotus, barley, wheat, Drosophila and zebrafish4,5,6,7,8,9.
Overview of TILLING
The TILLING procedure can be divided into a series of steps (Fig. 1). DNA is first extracted from test samples. DNA aliquots are pooled (typically eightfold) and arrayed into a multiwell microtiter plate containing 96 or 384 wells. Screening for mutations begins with PCR amplification of a target fragment of up to ∼1.5 kb using gene-specific infrared dye-labeled primers. The forward primer is 5′-end labeled with a fluorescent dye that is detected at ∼700 nm (IRDye 700) and the reverse primer is labeled with the IRDye 800, which is detected at ∼800 nm. After PCR amplification, samples are denatured and annealed to form heteroduplexes between mutant and wild-type DNA strands. Samples are then incubated with a single-strand specific nuclease to digest mismatched base pairs (Fig. 2a)10. After the reaction is stopped, DNA is purified from buffer components and sample volumes are reduced. A portion of each sample is then loaded onto a denaturing polyacrylamide slab gel. We use the LI-COR DNA analyzer system to visualize fluorescently labeled DNA. Two electronic image files are produced per gel run; one containing data from the 700-nm channel and the other from the 800-nm channel (Fig. 2b). Data analysis is aided by the use of GelBuddy, a freely available program for Macintosh and Windows PCs designed for the analysis of TILLING and Ecotilling gel data produced by the LI-COR analyzer11. The exact nucleotide change is then determined using standard DNA sequencing methods. With eightfold pooling, ∼1,600 samples can be screened per day for mutations in a single ∼1.5 kb gene target using a single LI-COR analyzer. Higher throughput and economy of scale can be achieved by using multiple thermal cyclers and analyzers.

Reagents can be prepared in advance, thus streamlining the high-throughput procedure. The approximate time required to prepare each reagent, along with an estimation of the length of time a reagent can be prepared in advance of screening is provided. The procedure for polymorphism discovery consists of (i) PCR amplification using fluorescently labeled gene-specific primers followed by the creation of heteroduplexed molecules by denaturing and annealing polymorphic amplicons, (ii) enzymatic cleavage of mismatched regions in heteroduplexed fragments, (iii) sample purification and volume reduction, (iv) polyacrylamide denaturing gel electrophoresis and (v) data analysis to discover polymorphic samples. The procedure can be completed in 1 day. Discovered polymorphisms can be sequenced to determine the exact nucleotide change. Sequencing is aided by the knowledge of the approximate position of the polymorphism acquired during gel electrophoresis.

Schematic diagram of enzymatic mismatch cleavage (a) and typical production TILLING data from a 1,169-bp Drosophila gene target (b). (a) PCR is performed using 5′ IRDye-labeled primers. The forward primer is labeled with IRDye 700 (blue four-point star) and the reverse with IRDye 800 (red five-point star). Heteroduplexed molecules are formed by denaturing and annealing amplified fragments. Mismatched regions are cleaved by treatment with a single-strand specific nuclease (green lightning bolts). Products are denatured and fragments are size-fractionated using denaturing polyacrylamide gel electrophoresis and visualized using an LI-COR DNA analyzer. The molecular weight of the cleaved IRDye 700 fragment (439 bp in this example) plus the IRDye 800 cleaved fragment (730 bp) equals the molecular weight of the full-length PCR product (1,169 bp). The molecular weights of the fragments provide the position of the nucleotide change. (b) IRDye 700 (left) and IRDye 800 (right) images shown for the same 25 lanes of a 96-lane gel image. True mutations (boxed) produce a fragment in the IRDye 700 image (blue boxes) and in the IRDye 800 image (red boxes). The fragments illustrated in panel a are marked on the right of each image. To aid in gel analysis, 200-bp lane markers are added in every eighth lane, beginning in lane number 4. Molecular weight ladders are added to the end lanes of the gel to facilitate molecular weight calibration (sizes listed to the left of the left image). A strong common band (marked by an arrow) coincides with a stretch of 14 thymine residues starting at position 751. The band likely arises from breathing and subsequent cleavage of the duplex in this region.
Several alternative TILLING protocols are available. For example, TILLING organisms with large introns, such as zebrafish, requires short exon targets, leading to the development of alternative protocols for zebrafish TILLING12,13. In addition, TILLING can be performed using alternative readout platforms including slab gel and capillary systems7 (http://www.jicgenomelab.co.uk/services/mutation-detection/development.html). Although many groups use an enzymatic mismatch cleavage approach similar to that described in this protocol, other mutation discovery methods can potentially be substituted including denaturing HPLC and resequencing (e.g., see refs. 2, 14, 15). When choosing a single-nucleotide polymorphism (SNP) discovery platform, it is important to consider criteria such as equipment cost, reagent cost, maintenance cost, automation and assay sensitivity.
High-throughput large-scale applications of TILLING
TILLING is a high-throughput, low-cost method that is suitable for a large-scale production operation. The first production-scale TILLING service to be offered was the Arabidopsis TILLING Project (ATP; http://tilling.fhcrc.org:9366/). Several computational tools were adapted to provide a completely web-based system for target selection, primer design and evaluation of sequence-verified mutations16. The service began in August 2001 and after 5 years of operation had delivered more than 6,700 mutations to the Arabidopsis community (http://tilling.fhcrc.org:9366/arab/status.html). Analysis of the first ∼2,000 mutations showed the expected 2:1 Mendelian ratio of heterozygous to homozygous mutations in samples pooled eightfold. Because heterozygous mutations will be present at half the concentration of homozygous mutations in an eightfold pool (1/16th vs 1/8th), it is clear that TILLING is sensitive and robust on a production scale1. Since October 2005, ATP has recovered its operating expenses, including materials, labor and overhead, from user fees, which provide a realistic cost estimate for production-scale TILLING. Currently, the ATP charges $1,500 to screen ∼3,000 lines, which includes DNA sequencing validation of mutations and a free replacement order should the initial screen fail. Approximately 90% of orders supplied by users are successful, with occasional failures usually attributable to primer design. ATP was used as a model to create maize (http://genome.purdue.edu/maizetilling/)4 and Drosophila (Fly-TILL, http://tilling.fhcrc.org:9366/fly) TILLING services. There are also several independent TILLING services, including a service for lotus (http://www.lotusjaponicus.org/tillingpages/homepage.htm) and barley (http://www.scri.sari.ac.uk/programme1/BarleyTILLING.htm), which further illustrates the value of the method for production-scale reverse genetics.
Ecotilling
The TILLING protocol that we developed for reverse genetics has been adapted to survey natural variation within populations. Our first Ecotilling project was accidental: we noticed bands in common for some individuals, which we realized were contaminants from a different Arabidopsis accession (“ecotype”) from that used in the mutagenesis. A systematic survey of ∼200 ecotypes indicated that the method is accurate and robust17. We found that multiple polymorphisms, including SNPs, small indels and variations in satellite repeat number could be discovered within a single target region. Detection of dozens of polymorphisms in a single fragment is possible because only a small fraction of heteroduplexes are cleaved at any single position by the CEL I nuclease used for TILLING10,17. Ecotilling can be used to discover and catalog common polymorphisms without sample pooling, as was done for Arabidopsis and the black cottonwood (Populus trichocarpa)18. To detect homozygous polymorphisms, an equal amount of DNA from a reference sample is added to each assay well. However, when rare nucleotide polymorphisms are sought, samples can be pooled, as we have recently illustrated in using Ecotilling to discover rare SNPs in the human genome19.
Other potential applications
The protocol described here allows for the low-cost discovery of induced mutations and natural nucleotide polymorphisms on a production scale. The use of standard bench techniques and equipment makes TILLING and Ecotilling additionally attractive for smaller scale projects. We can also foresee the extension of this protocol to other applications, where the rapid and low-cost discovery of SNPs, indels and other small nucleotide polymorphisms is desired, such as the identification of polymorphisms associated with quantitative traits and the screening for rare mutations in cancer.
Limitations of TILLING
A successful TILLING project depends on the development of a densely mutagenized population and the preparation of DNA of suitable quality for PCR. Because protocols for chemical mutagenesis in different plant and animal species can vary dramatically, no single protocol can be considered general, and so we do not provide one here. Although many species have been successfully mutagenized, others have been less tractable for reasons that are not clear. In cases where mutagenesis is unfeasible, natural nucleotide diversity can nevertheless be discovered by Ecotilling. In theory, mutation discovery may be limited in highly heterozygous species where the large number of bands from natural polymorphisms could potentially inhibit the detection of rare induced mutations. When encountering problems obtaining consistent PCR amplification, alternative extraction methods or additives to the PCR mixture, or both, may be needed to ensure robust PCR20.
Materials
Reagents
-
FastPrep DNA Kit (MP Biomedicals cat. no. 6540-400)
-
Ribonuclease A (Sigma cat. no. R6513-10MG)
-
Ammonium sulfate ((NH4)2SO4; Sigma cat. no. A2939)
-
PMSF (Sigma cat. no. P7626-5G)
Caution
PMSF is hazardous. Wear gloves; avoid direct contact with skin or inhalation
-
1 M PMSF (stock in isopropanol). To prepare an aqueous solution of 100 μM PMSF, add 1 ml 0.1 M PMSF per liter of solution immediately before use
-
Tris/KCl/PMSF buffer: 0.1 M Tris-HCl pH 7.7, 0.5 M KCl and 100 μM PMSF in water
-
TE buffer: 10 mM Tris-HCl pH 7.5 and 1 mM EDTA prepared in water
-
Hot start Ex-Taq polymerase (Takara cat. no. RR006B)
-
Ex-Taq buffer (supplied in kit with Ex-Taq polymerase)
-
dNTPs (2.5 mM each, supplied in kit with Ex-Taq polymerase)
-
MgCl2 (25 mM in water)
-
Unlabeled forward and reverse gene-specific primers (see REAGENT SETUP)
-
IRDye 700 (forward) and IRDye 800 (reverse) labeled primers of the same sequence as the unlabeled primers (MWG Biotech)
Critical
Limit exposure of IRDye-labeled primers to fluorescent light. Repeated freeze–thaw cycles can reduce fluorescent signal. Make multiple aliquots and store at −80 °C. Working stocks can be kept at −20 °C for months as long as thawing is limited
-
Celery juice extract (prepared as described in Box 2)
-
10 × digestion buffer: 37.5 ml water, 5 μl 20 mg ml−1 BSA, 100 μl 10% Triton X-100 (vol/vol), 2.5 ml 2 M KCl, 5 ml 1 M HEPES pH 7.5 and 5 ml 1 M MgSO4. Prepare in advance and store aliquots at −20 °C
-
Sephadex G-50 medium (Amersham Pharmacia cat. no. 17-0043-02)
-
Formamide load buffer: 19.2 ml deionized formamide, 770 μl 0.25 M EDTA pH 8 and ∼1 mg bromophenol blue. Store for long periods at −20 °C. Working stocks can be held at 4 °C for 1 week
-
Isopropyl alcohol (Sigma cat. no. I9030)
-
Ficoll (Fisher cat. no. BP525-100). Prepare a 1% (wt/vol)solution in water. Aliquots can be stored at −20 °C for months. Working stocks can be stored at 4 °C for up to 2 weeks
-
APS ((NH4)2S2O8) (Sigma cat. no. A3678-25G)
-
TEMED (N,N,N′,N′-tetra methylethylene diamine) (Sigma cat. no. T9281)
-
KB+ 6.5% acrylamide gel matrix (LI-COR cat. no. 827-05607)
Caution
Acrylamide, TEMED and APS are hazardous. Avoid contact with skin and inhalation; wear protective clothing, gloves and goggles
-
0.8 × TBE running buffer: 89.2 g Tris-base, 45.8 g boric acid (H3BO3) and 68 ml 0.25 M EDTA pH 8; adjust the final volume to 10 liter with water
Equipment
-
FastPrep Instrument for DNA extraction (MP Biomedicals cat. no. 6001-120) or equivalent upgrade
-
Microcentrifuge (Labnet International cat. no. C0233M-2) or equivalent
-
20 and 200 μl variable volume multichannel pipettes (Rainin cat. nos. L8-20, L8-200) or equivalent
-
300 μl variable volume electric multichannel pipette (Rainin, cat. no. E8-300) or equivalent (used for distributing PCR mix into multiwell plates)
-
Multichannel electronic pipettor with expandable equal tip spacing (Matrix cat. no. 2139), used for transferring samples from tubes into 96- or 384-well sample plates
-
Vegetable juicer, L'EQUIPE Model 110.5 or equivalent
-
Stir plate (Fisher cat. no. 11-500-49SH)
-
Nanopure (water treatment) (VWR (Barnstead) cat. no. 13500-866)
-
pH meter (Fisher cat. no. 13-636-AR10)
-
Centrifuge 5804 (Brinkman cat. no. 2262250-1) or equivalent
-
Thermal cyclers, for example, dual 384-well GeneAmp PCR system 9700 (Applied Biosystems cat. no. N8050002)
-
LI-COR 4300 S DNA Analyzer (LI-COR cat. no. 4300-02)
-
Vacuum sealer, for example, FoodSaver V900
-
Filter paper (Fisher cat. no. 09-806A)
-
100-tooth membrane combs (Gel Company cat. no. CAJ96)
-
25 cm glass plates, 25 mm spacers, 25 mm gel casting comb, gel rails and other accessories provided with the LI-COR DNA analyzer. Additional materials can be purchased from LI-COR or the Gel Company
-
Skirted 96-well plates (Island Scientific cat. no. IS-800ARS)
-
Millipore centrifuge alignment frame (Fisher cat. no. MACF09604)
-
Millipore multiscreen 96-well separation plate (Fisher cat. no. MAHVN4550)
-
Millipore multiscreen column loader (Fisher cat. no. MACL09645)
-
Buffer Reservoir (Appogent Discoveries cat. no. 8095)
-
96- or 384-well reaction plates for PCR (Island Scientific cat. no. IS-800ARS or Abgene cat. no. TF-0384)
-
Plate sealing adhesive tape (Applied Biosystems cat. no.4306311)
-
Spectra/Por* 7 Dialysis Membrane, 10,000 MWCO (VWR cat. no. 25223-800)
-
Spectra/Por* Closures (VWR cat. no. 25224-100)
-
96- or 384-tip pipetting device (Apricot Designs cat. nos. PP550DS or PP125DS) (optional)
-
96-lane loading tray 1.5 mm spacing (Gel Company cat. no. TAY96) (optional)
-
Comb-loading robot (Aviso USA, Ltd, cat# 8115-030201) (optional)
Reagent Setup
-
Primer design Primers should be designed to amplify a single target region. We have found that increasing the melting temperature of primers reduces low molecular weight background noise in TILLING assays, presumably arising from nonspecific primer hybridization. We use the web-based tool CODDLe (http://proweb.org/coddle) to select gene regions that have the highest density of potentially deleterious mutations caused by treatment with chemical mutagens16,21. Primers are designed by CODDLe using the Primer 3 program22 with melting temperatures from 67 to 73 °C and of a length in the range of 20–30 nucleotides. A 100 μM solution of each primer is prepared in TE buffer and aliquots are stored at −80 °C to avoid repeated freeze–thaw cycles that could reduce fluorescent activity.
-
Optimizing the amount of genomic DNA for PCR • TIMING ∼10 h After DNA extraction and concentration normalization (Box 1), the optimal amount of genomic DNA to use for PCR should be determined empirically, by following the standard TILLING protocol with varying amounts of genomic DNA. For most organisms, we have determined the optimal amount of genomic DNA by using a molar ratio between primer and genomic DNA similar to that originally determined to be optimal for Arabidopsis. For example, 0.375 ng of Drosophila genomic DNA is used per PCR reaction. For maize, with a genome size approximately 14 times that of Drosophila, 4.5 ng of genomic DNA is used per amplification reaction. A concentration is chosen that provides the best signal-to-noise ratio when using a fixed amount of enzyme for heteroduplex digestion (Fig. 3). A higher concentration may be required when using lower quality genomic DNA samples (Fig. 4).
Figure 3: Gel image showing the effect of genomic DNA concentration on TILLING data. 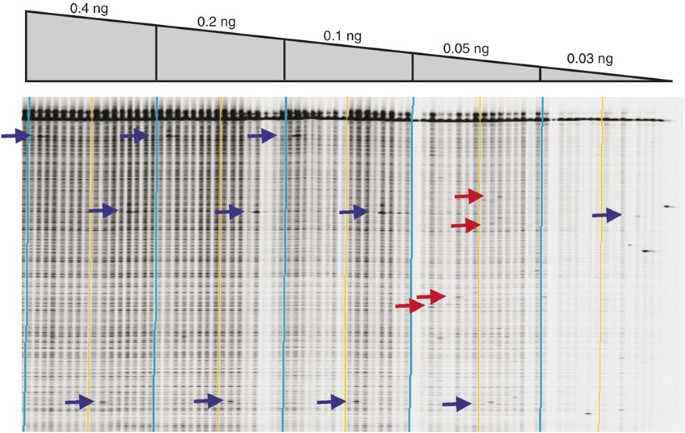
An LI-COR IRDye 700 image shown for a ∼1,000-bp Arabidopsis gene target. PCR was performed on 16 unique samples using different DNA concentrations (listed above the gel image). Vertical lines produced by the GelBuddy program bracket every eight lanes (a useful feature when using a 2D pooling strategy). Light blue lines bracket the set of 16 samples at different concentrations. Each sample contains DNA from a pool of eight different Arabidopsis plants. Blue arrows mark known mutations. At DNA concentrations of 0.05 and 0.03 ng, true mutations are lost and false-positive signals begin to appear (examples are marked by red arrows). Loss of positive signals at low concentrations may result from a failure to amplify from the small number of mutant genomic targets in the early rounds of PCR. False-positive signals likely arise from rare random Taq errors occurring on single molecules in the early rounds of PCR. When using low concentrations of genomic DNA, these induced errors represent a sufficient proportion of the total number of amplified molecules, such that they are visible as cleaved products on the LI-COR gel image. Errors of this type are not seen when using higher concentrations of genomic DNA because they are present on only one of thousands of PCR products produced during early rounds of amplification, and are thus beyond the limits of detection. Genomic DNA concentrations of 0.1 or 0.2 ng produce the best signal-to-noise ratio in this gel image. After testing more than five different gene targets, we determined that the target shown here produced a greater-than-average yield of PCR product, and ∼0.4 ng of genomic template was chosen as the standard amount of DNA to use in all Arabidopsis PCR reactions. Single target optimization is impractical for high-throughput production.
Figure 4: Examples of genomic DNA quality. 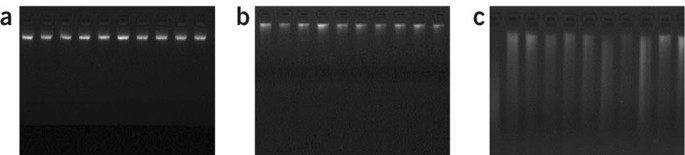
High-quality (a), medium-quality (b) and low-quality (c) genomic DNA as assayed by agarose gel electrophoresis and ethidium bromide staining. With adequate quantification, medium-quality genomic DNA can be used to produce high-quality TILLING and Ecotilling gel data. The use of low-quality genomic DNA can result in low-quality TILLING and Ecotilling data, likely owing to the inhibitory effect of fragmented DNA on PCR amplification. Fragmented DNA can also lead to inaccurate quantification, which might lead to false-negative errors in pooled samples.
-
Optimizing the amount of single-strand-specific nuclease • TIMING ∼10 h The optimal amount of single-strand-specific nuclease for heteroduplex digestion should be determined empirically. We have found that the activity in celery juice extract remains stable for more than 1 year at −80 °C, and therefore use the same amount of enzyme for all TILLING and Ecotilling reactions performed in our laboratory. A celery juice extraction protocol is provided in Box 2. To determine the optimal amount of enzyme, perform TILLING reactions with varying amounts of enzyme and choose the amount that provides the best signal-to-noise ratio. We have measured similar activities from many independent celery juice extractions, and so the amount used in this protocol can serve as a guide. Using too little enzyme results in a very dark image where true bands are difficult to discover above the background of PCR failure products. Adding too much enzyme results in a blank image, presumably because the enzyme cleaves off the IRDye label from the 5′ DNA ends when the duplex “breathes” (Fig. 5).
Figure 5: Gel image showing the effect of the amount of celery juice extract used to cleave mismatches. 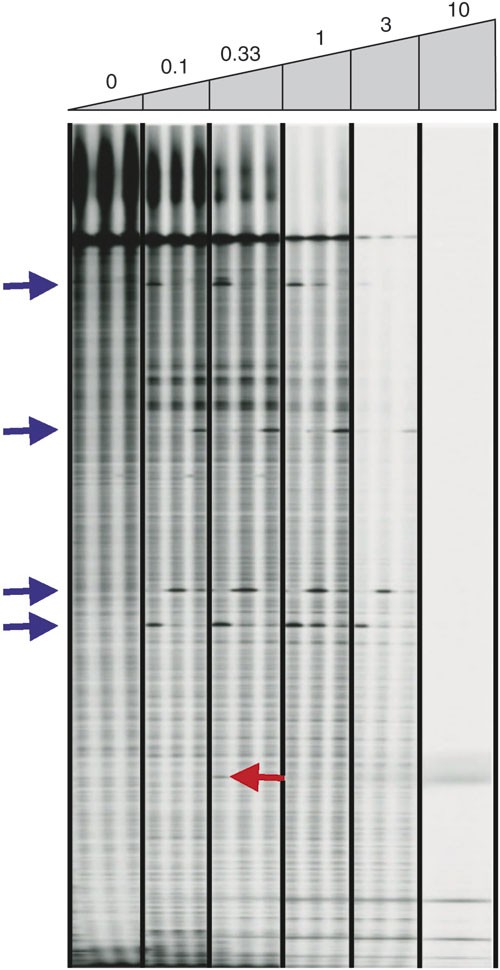
An LI-COR IRDye 700 image shown for an ∼1,000-bp Arabidopsis gene target. Three samples containing known nucleotide polymorphisms were treated with increasing amounts of celery juice extract (listed above gel image). Units of celery juice activity are listed, with 1 unit defined as the amount providing the best signal-to-noise ratio. Blue arrows mark the location of true polymorphisms. The red arrow marks a band that is present in both image channels at the same position, likely resulting from a spurious mispriming event. Signal and noise decrease with increasing amounts of extract, presumably owing to cleavage of the end label as the duplex “breathes”. This figure is modified from ref. 10.
-
Determining the number of samples to pool • TIMING ∼10 h The number of samples to pool together before a screen can be determined empirically by testing multiple mutations or polymorphisms at different levels of sample pooling. For TILLING, only a small percentage of individuals will harbor a mutation in the PCR amplicon, so that doubling the number of individuals in a pool will provide nearly a twofold increase in the throughput of mutation discovery. For Ecotilling, the expected frequency of nucleotide polymorphism will influence the level of desired pooling. When cataloging common nucleotide changes, pooling is not appropriate because of the additional work needed to determine which individuals in a pool harbor the polymorphism17,18. However, for rare polymorphisms, pooling reduces effort but will obscure the identification of very common polymorphisms. For example, we discovered rare human SNPs much more efficiently in eightfold pools than in unpooled samples, but common SNPs were in many pools, making the task of identifying the individuals harboring very common SNPs more time consuming than if screening were performed on unpooled samples19. Note that if sample pooling is not used, homozygous nucleotide changes will be discovered only if reference DNA is added to each sample. See Box 3 and Figure 6 for recommended pooling strategies.
Figure 6: Pooling strategies used for TILLING and Ecotilling. 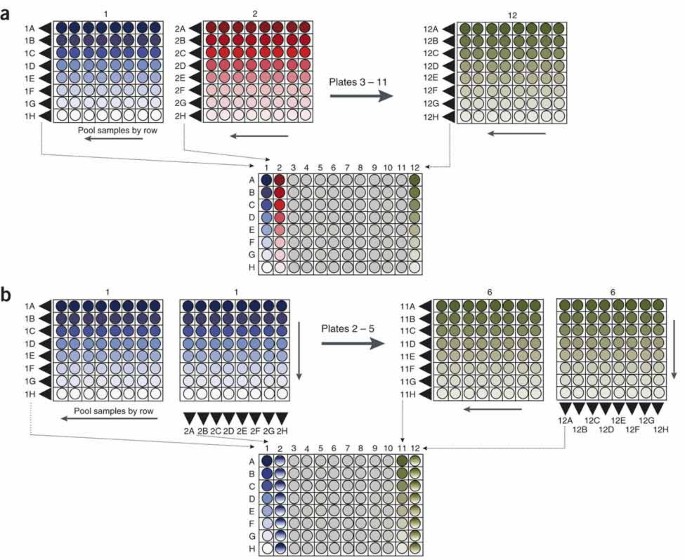
Samples are first arrayed in an 8 × 8 grid of 64 individual samples. (a) For one dimensional (1D) pooling, all eight samples in a row of the 8 × 8 plate are pooled together. Using an eight-channel pipettor, all 64 samples from an 8 × 8 plate can be pooled together with eight pipetting steps. The first 64 samples are deposited in column 1 of the 1D plate. Samples from the second 8 × 8 plate are deposited in column 2, and so on, for a total of 12 8 × 8 plates used to make a 1D plate containing 768 unique individuals. (b) For two dimensional (2D) pooling, samples from a common row on an 8 × 8 plate are first pooled as in (a). Samples from a common column are then pooled and deposited in the adjacent column of the 2D plate. A total of 384 unique samples are deposited in the 96-well 2D pool plate.
-
Preparation of ladders and lane markers • TIMING 3 h 30 min IRDye ladders are commercially available; however, assay cost can be reduced by preparing custom ladders and lane markers. Design primers to produce PCR products of desired length. Follow the PCR amplification protocol (Steps 1–6) using genomic DNA of the corresponding species. After PCR amplification, purify the product through a Sephadex G50 spin plate, without the addition of formamide load dye or lane marker to the catch plate, and omitting the sample volume reduction step described in Step 19. Combine sample wells into a single tube and store at −20 °C. This is the concentrated stock. Determine the amount to use empirically, typically ∼0.13 ng per lane. Prepare a 200-bp fragment as a lane marker. To create a ladder, combine fragments of different molecular weights. This ladder should include a 700-bp fragment if using GelBuddy for image analysis.


Equipment Setup
-
Preparation of Sephadex spin plates • TIMING ∼1 h 5 min Fill the wells of the Millipore column loader with dry Sephadex G-50 powder. Remove excess powder with the supplied scraper. Lay a clean Millipore 96-well separation plate on top of the filled loader. Invert the plate and loader to deposit Sephadex into the plate. To ensure that all Sephadex enters the plate, tap the back of the loader with scissors. Remove the loader and clean off any excess Sephadex powder on top of the plate with a fine paintbrush. To hydrate the Sephadex, add 300 μl water to each well and let stand for 1 h before use. Plates can be stored for up to 1 week at 4 °C in a sealed plastic bag containing a moist towel to prevent dehydration. Before use, gently rinse the bottom of the plate to remove excess Sephadex. When sample purification is complete, store the used plate for approximately 3 days until the Sephadex has dehydrated. Discard the Sephadex, rinse the plate thoroughly with water and allow it to completely dry before reuse (1–3 days depending on room temperature and humidity). Plates can be reused at least six times.
-
Preparation of acrylamide gels • TIMING 2 h Clean glass plates and assemble spacers and rails following the protocol provided with the LI-COR DNA analyzer. Combine 20 ml of 6.5% acrylamide gel matrix, 15 μl TEMED and 150 μl 10% APS. Use a plastic syringe to deposit the acrylamide solution between glass plates. When done, insert the casting comb and apply the pressure plate. Pour excess acrylamide solution onto comb. Let it stand for 90 min before use. To store gels, apply a damp paper towel to each end of the gel and cover in plastic wrap. Gels can be stored for up to 1 week at 4 °C. Before use, thoroughly wash both the front and back plate, remove the casting comb and remove all acrylamide from the well. Before placing the plates in the LI-COR DNA analyzer, clean them with isopropanol, making sure that the laser detection region is clean. After the run is complete, the samples will have passed through the gel and new samples can be applied and the gel run again. Only two runs are suggested because the sample image becomes diffuse and hard to interpret during the third run.
Caution
Acrylamide, TEMED and APS are hazardous. Avoid contact with skin and inhalation; wear protective clothing, gloves and goggles.
-
Reusing membrane combs • TIMING ∼40 min A membrane comb can be reused many times until its teeth become bent and the comb is no longer easy to insert into the gel well. Clean a comb by soaking in a tub of deionized water for at least 30 min. If many combs are washed at once, care should be taken to avoid comb damage, and water should be exchanged several times to ensure the combs are thoroughly cleaned. Air-dry combs for several days before reusing.
Procedure
PCR amplification of target regions and heteroduplex formation
Timing ∼3 h 30 min
-
1
Prepare genomic DNA as outlined in Box 1 or by any other appropriate method. Pool samples and prepare assay plates containing 5 μl of genomic DNA per well, as detailed in Box 3. These can be prepared fresh, or prepared in advance and frozen until required.
-
2
Make a fresh mixture of unlabeled and labeled primers. Mix 100 μM stock primers at a ratio of 3:2:4:1 (IRDye 700 primer:unlabeled forward primer:IRDye 800 primer:unlabeled reverse primer). We do not store primers in mixed form, and therefore only make enough primer mixture for the number of reactions we are performing. To minimize pipetting errors, the minimal volume of primer mixture we prepare is 10 μl (enough for two 96-well reaction plates).
Critical Step
Limit exposure of IRDye-labeled primers to fluorescent light.
-
3
Prepare the 96-well PCR master mix as outlined below (extra volume is made to avoid pipetting errors), adding Taq enzyme last. Vortex thoroughly.
Table 2 Critical Step
IRDye-labeled primers are sensitive to fluorescent light. When possible, lighting should be dimmed and samples shielded from direct light. Keep Taq polymerase on ice. The master mix components can be prepared at room temperature when using a hot-start Taq.
-
4
Add 5 μl of PCR master mix to each well of the assay plate and seal the plate with adhesive tape.
-
5
Spin the plate for 2 min at 1,300g at room temperature (approximately 19–25 °C).
-
6
Place the plate in the thermal cycler and run the following amplification program:
Table 3 Pause point
When cycling is complete, the plate can be stored at −20 °C for weeks. Note that fluorescent signal can decay over time and it is best to process the assay plate as soon as possible.
Heteroduplex digestion
Timing ∼40 min
-
7
Prepare the celery juice extract reaction mix, as outlined below, and store on ice. The volumes indicated are sufficient for two 96-well plates. Details of how to prepare celery juice extract are provided in Box 2.
Critical Step
We have tested a variety of enzymes and enzyme preparations for TILLING and Ecotilling in addition to celery juice extract. These include commercially available Surveyor nuclease, mung bean nuclease and S1 nuclease10. When using commercial sources of S1 or mung bean nucleases, do not use the accompanying buffers because these are optimized for different applications.
Critical Step
The nuclease concentration in each batch of celery juice extract must be determined empirically (see REAGENT SETUP). The amount listed here is for illustration purposes only.
Table 4 -
8
Spin the assay plate for 2 min at 1,300g at room temperature.
-
9
Add 20 μl of celery juice extract reaction mix to each well of the plate. Mixing is optional, but is recommended when practical (e.g., using a multitip pipetting device).
-
10
Spin the assay plate for 2 min at 1,300g at room temperature.
-
11
Incubate the plate for 15 min at 45 °C.
-
12
Spin the assay plate for 2 min at 1,300g at room temperature.
-
13
Stop the reaction by adding 5 μl of 0.225 M EDTA to each well of the assay plate.
Pause point
The assay plate can be stored at −20 °C for weeks. Note that the fluorescent signal can decay over time and it is best to process the assay plate as soon as possible.
Sample purification
Timing ∼1 h
-
14
Prepare one catch plate for each 96-well reaction plate before performing Sephadex purification. Add 1.5 μl of formamide load buffer to each well of the catch plate. Add ∼2 μl of 200-bp lane marker to the plate such that marker is deposited every eight lanes beginning with lane 4 (e.g., 4, 12, 20 and so on).
Critical Step
Alternatives: In theory, any method that provides both salt and buffer removal in addition to volume reduction can be used in place of the Sephadex G50 column. A less expensive alternative would be alcohol precipitation12. When testing options, consider the time required, the percent of sample recovery and the material cost of the assay.
-
15
Assemble a Sephadex G50 plate, an alignment frame and an empty 96-well waste plate to catch water. Centrifuge the assembly for 2 min at 440g at room temperature.
-
16
Remove the waste plate and attach a sample catch plate containing formamide load dye and lane markers.
-
17
Apply the full sample volume from the assay plate onto the 96-well Sephadex plate. If using a 384-well assay plate, each quadrant of the plate is applied to a separate Sephadex plate. This is necessary because a maximum of 100 sample lanes can be loaded on an LI-COR gel.
Critical Step
Apply the samples directly over the centers of the packed Sephadex columns and do not touch the columns with pipette tips. Make sure that the sample catch plate is properly labeled and that the samples maintain the same orientation between plates (position A1 of assay plate equals A1, and not H12, of sample catch plate).
-
18
Spin the Sephadex plate/catch plate assembly for 2 min at 440g at room temperature.
-
19
Remove the catch plate containing the DNA solutions. Reduce sample volumes by incubating the plate for 45 min at 85 °C, or until only 1.5 μl remains in each well.
Pause point
After volume reduction, the plate can be stored at 4 °C for several weeks. Note that fluorescent signal can decay over time and it is best to process the assay plate as soon as possible.
Loading samples onto 100-tooth membrane combs
Timing 10–40 min
-
20
Heat the sample catch plate for 5 min at 90 °C.
-
21
Store the sample on ice for at least 3 min before loading.
-
22
Apply ∼0.5 μl of sample per membrane comb tooth starting with tooth number 4 and ending with tooth number 99. The bottom 1/3 of the tooth should be stained blue after loading.
-
23
Apply ∼0.25 μl of molecular weight ladder to teeth 1, 3 and 100. This asymmetry ensures that sample 1 is never confused with sample 96 in the event that the comb is inverted before application to the gel. There are several options for loading samples onto membrane combs. The sample can be applied directly using a single-channel pipettor, can be preloaded into a comb-loading tray or the sample can be loaded directly using a comb-loading robot. Although the comb-loading robot is advantageous in that human error is reduced and loading is automated, using a comb-loading tray and a multichannel pipettor provides an inexpensive alternative.
Pause point
The loaded membrane comb can be stored for an extended period of time before loading (at least 24 h). As the fluorescent signal can decay over time, it is advised to apply the comb to the gel within 2 h of loading.
Critical Step
Alternatives: Samples can be loaded directly onto the gel using a sharks tooth or a square tooth comb. Although 96-tooth sharks tooth combs are available, loading can be tricky. Loading fewer than 96 samples on a single LI-COR gel reduces throughput without providing any clear benefit for data analysis.
Loading and running gels
Timing ∼20 min for pre-run and comb application, 4h 15 min for gel running
-
24
Remove a pre-poured gel from 4 °C storage.
-
25
Clean the gel well and glass and insert the plate assembly into LI-COR DNA analyzer. Fill the upper and lower buffer tanks with 0.8 × TBE buffer.
-
26
Pre-run the gel for 20 min, ensuring that the lasers focus properly (40 mA, 40 W, 1,500 V, 50 °C, image width 1,028 and scan speed 2).
-
27
Rinse the gel well thoroughly using a plastic 10-ml syringe with no needle attached.
-
28
Remove buffer from the upper tank. Remove excess liquid from the gel well by inserting filter paper into the gel well.
-
29
Remove the filter paper and add 1ml Ficoll solution to the gel well. A small bead should form at the edge of the front glass plate.
-
30
Insert the loaded membrane comb into the gel well at a 45° angle. Once the teeth touch the Ficoll solution, the comb should slide smoothly into the well. The comb should be gently inserted into the well and the teeth should not be forced into the acrylamide.
-
31
Gently fill the upper buffer tank with 0.8 × TBE buffer and replace the top electrode.
-
32
Start a 4 h 15 min gel run (40 mA, 40 W, 1,500 V, 50 °C, image width 1,028 and scan speed 2).
Optional: After 10 min, remove the comb and gently rinse the Ficoll out of the gel well. Re-insert the top electrode and close the LI-COR door. The 4,200-series machines will automatically restart. If using a 4,300-series machine, the run will remain paused until the continue option is selected. We typically start runs at the end of the day and leave the machines running unattended.
Critical Step
Excessive washing of the well can disturb the gel and result in lower quality gel data.
LI-COR gel analysis
Timing 10 min–1 h
-
33
Download the most recent version of GelBuddy from http://www.proweb.org/gelbuddy/. Installation instructions, technical documentation and descriptions of additional features are provided on the GelBuddy web site.
-
34
Download IRDye 700 and IRDye 800 TIFF images from the LI-COR to your desktop.
-
35
Open GelBuddy. Import images by using the “File/Open 700 and 800 Channel Images” menu command.
-
36
Adjust the 700-channel image so that background bands become visible, using the slider bars at the top of the GelBuddy window.
-
37
Click the “Select Channel” toolbar button at the top of the window to view the 800-channel image. (Each button may be identified by the text that appears when the mouse cursor is placed over the button.) Adjust the 800-channel image as in Step 36.
-
38
Call lanes. Click the “Find Lanes” button. Set the number of sample lanes in the “Find Lanes” pop-up window (96 for a standard TILLING/Ecotilling run). Unless one of the channels is very weak, use both channels for detecting lanes. After clicking the “OK” button, automatically generated lane tracks will be superimposed on the displayed gel image.
-
39
Edit lanes. Blue lane tracks should run through the 200-bp marker band found in every eighth lane starting with lane number 4. If the blue lane tracks do not coincide with the 200-bp markers, or if any lane tracks deviate from the sample lanes in the image, click the “Edit Lanes Mode” button. Click the mouse over the lane you wish to edit or delete, or over the lane adjacent to the area where you wish to add lanes. Use the “Edit/Insert Lanes” or “Edit/Delete Lane” menu command to insert or delete lanes. To change the path of a single lane track, drag the boxes on the selected lane horizontally to the desired location. When finished, click the “Show Lanes” button to hide the lane tracks.
-
40
Adjust the fragment length calibration ladder. The ladder is adjusted by dragging markers at the left margin of the image. Click the “Show Calibration Information” button. Curves representing the calibration ladder will be superimposed on the gel image. Place the mouse over the blue number 700 and drag the number vertically to place the corresponding calibration curve over the 700-bp-size standard band. Do the same with number 200, making sure the corresponding curve overlaps the 200-bp lane marker bands. Set the migration limit markers by dragging the red numbers to the bottom of the signal on the gel image (100%) and to the top of the full-length product (0%). When complete, click the “Show Calibration Information” button again to hide the calibration ladder.
-
41
Mark mutations. GelBuddy provides automatic (A) and manual (B) band marking tools. The automatic band marking tool is most appropriate for analysis of Ecotilling images containing many cleavage product bands. The manual band marking tool can be used as the sole means to mark an image containing few cleavage products or to edit an automatically generated markup.
-
A
Automatic band marking (optional)
-
i
Click the “Analyze” button. The “Edit Gel Information” pop-up window will appear.
-
ii
Enter the size of the full-length product and click “OK”. A log window will appear showing the progress of automated band detection. The total analysis time will appear when analysis is complete.
-
iii
Close the log window to view the marked image.
-
i
-
B
Manual band marking
-
i
Click the “Record Signals Mode” button. If you have not yet specified the size of the full-length product, you will be prompted to do so at this time. Enter the size of the full-length product and click “OK”. Use the “Select Channel” button to switch between channels.
-
ii
Click the mouse over a cleavage product band to mark it. Each mark in the 700 channel is indicated by a red box and each mark in the 800 channel is indicated by a blue box. To delete a mark, select the channel containing the marked band, place the cursor over the box and click the mouse while pressing the “Option” key (on Macintosh OS X) or “Alt” key (on Windows). If you are unsure of a mutation, note that when the mouse is over an image band, the inferred size of the cleavage product is indicated at the bottom of the window. For each polymorphism, the inferred cleavage product sizes for the blue and red boxes should sum to approximately the size of the full-length product.
-
i
-
A
-
42
Edit signal groups. GelBuddy automatically links comigrating bands to facilitate assignment of samples to haplotype groups in Ecotilling applications. If you wish to review and edit grouping of comigrating bands, click the “Edit Signal Groups Mode” button. Each group will appear as a set of colored boxes linked by horizontal lines. To select multiple bands, click on the first band you wish to select, then click on additional bands while pressing the “Shift” key. The “Edit/Group Selected Signals”, “Edit/Merge Selected Signal Groups” and “Edit/Remove Selected Signals From Group” menu commands may then be used to alter signal grouping.
-
43
For two-dimensional (2D) pooling applications, the “Options/Show Pool Boundaries” menu command may be used to display lines delineating sets of row and column pools (vertical lines in Fig. 3).
-
44
View report. A text report containing a list of paired 700- and 800-channel bands, lists of comigrating bands and other information may be viewed by selecting the “Report/View Concise Report” menu command. Use the “Report/Save Concise Report” command to save this report for future reference.
-
45
Save the gel markup file using the “File/Save Gel Markup” menu command. The “File/Open Gel Markup” command may be used during subsequent GelBuddy sessions to load the markup file for review or revision.
Troubleshooting
Troubleshooting advice can be found in Table 1.
Timing
Approximate times for the major reagent preparation steps and the high-throughput screening procedure are listed in Figure 1.
Anticipated results
True polymorphisms will produce two cleaved fragments, one in the IRDye 700–channel image and another in the IRDye 800-channel image whose molecular weights add up to the molecular weight of the full-length PCR product. The full-length PCR product should produce a sharp and intense band toward the top of the gel image. Background bands arising from incomplete PCR should be of lower intensity (Fig. 2). Assays can be optimized to increase the signal-to-noise ratio by altering the amount of genomic DNA used in PCR and the amount of enzyme used for mismatch cleavage (Figs. 3 and 5). Bands that are scored on TILLING and Ecotilling gels should represent true nucleotide polymorphisms. This can be verified by sequencing the putative polymorphic individual.
References
Greene, E.A. et al. Spectrum of chemically induced mutations from a large-scale reverse-genetic screen in Arabidopsis. Genetics 164, 731–740 (2003).
McCallum, C.M., Comai, L., Greene, E.A. & Henikoff, S. Targeted screening for induced mutations. Nat. Biotechnol. 18, 455–457 (2000).
Colbert, T. et al. High-throughput screening for induced point mutations. Plant Physiol. 126, 480–484 (2001).
Till, B.J. et al. Discovery of induced point mutations in maize genes by TILLING. BMC Plant Biol. 4, 12 (2004).
Wienholds, E. et al. Efficient target-selected mutagenesis in zebrafish. Genome Res. 13, 2700–2707 (2003).
Winkler, S. et al. Target-selected mutant screen by TILLING in Drosophila. Genome Res. 15, 718–723 (2005).
Perry, J.A. et al. A TILLING reverse genetics tool and a web-accessible collection of mutants of the legume Lotus japonicus. Plant Physiol. 131, 866–871 (2003).
Slade, A.J., Fuerstenberg, S.I., Loeffler, D., Steine, M.N. & Facciotti, D. A reverse genetic, nontransgenic approach to wheat crop improvement by TILLING. Nat. Biotechnol. 23, 75–81 (2005).
Caldwell, D.G. et al. A structured mutant population for forward and reverse genetics in Barley (Hordeum vulgare L.). Plant J. 40, 143–150 (2004).
Till, B.J., Burtner, C., Comai, L. & Henikoff, S. Mismatch cleavage by single-strand specific nucleases. Nucleic Acids Res. 32, 2632–2641 (2004).
Zerr, T. & Henikoff, S. Automated band mapping in electrophoretic gel images using background information. Nucleic Acids Res. 33, 2806–2812 (2005).
Draper, B.W., McCallum, C.M., Stout, J.L., Slade, A.J. & Moens, C.B. A high-throughput method for identifying N-ethyl-N-nitrosourea (ENU)-induced point mutations in zebrafish. Methods Cell Biol. 77, 91–112 (2004).
Wienholds, E. & Plasterk, R.H. Target-selected gene inactivation in zebrafish. Methods Cell Biol. 77, 69–90 (2004).
Bentley, A., MacLennan, B., Calvo, J. & Dearolf, C.R. Targeted recovery of mutations in Drosophila. Genetics 156, 1169–1173 (2000).
Wienholds, E., Schulte-Merker, S., Walderich, B. & Plasterk, R.H. Target-selected inactivation of the zebrafish rag1 gene. Science 297, 99–102 (2002).
Till, B.J. et al. Large-scale discovery of induced point mutations with high-throughput TILLING. Genome Res. 13, 524–530 (2003).
Comai, L. et al. Efficient discovery of DNA polymorphisms in natural populations by Ecotilling. Plant J. 37, 778–786 (2004).
Gilchrist, E.J. et al. Use of Ecotilling as an efficient SNP discovery tool to survey genetic variation in wild populations of Populus trichocarpa. Mol. Ecol. 15, 1367–1378 (2006).
Till, B.J. et al. High-throughput discovery of rare human nucleotide polymorphisms by Ecotilling. Nucleic Acids Res. 34, e99 (2006).
Wilson, I.G. Inhibition and facilitation of nucleic acid amplification. Appl. Environ. Microbiol. 63, 3741–3751 (1997).
McCallum, C.M., Comai, L., Greene, E.A. & Henikoff, S. Targeting induced local lesions IN genomes (TILLING) for plant functional genomics. Plant Physiol. 123, 439–442 (2000).
Rozen, S. & Skaletsky, H. Primer3 on the WWW for general users and for biologist programmers. Methods Mol. Biol. 132, 365–386 (2000).
Acknowledgements
We thank the past members of the TILLING team for their input on protocol improvement and development. Steve Reynolds, Kim Young and Rob Laport developed modifications for extracting DNA using the FastPrep kit. We thank the current TILLING team—Jennifer Cooper, Christine Codomo, Aaron Holm, Margaret Darlow and Lindsay Soetaert—for their continued input on data quality and protocol improvement. We thank Takehito Furuyama and other members of the Henikoff lab for helpful discussions on the effect of low amounts of genomic DNA on PCR amplification and enzymatic mismatch cleavage. We thank Elizabeth Greene, Samson Kwong and Jorja Henikoff for developing the computational and informatics tools required to run a high-throughput production laboratory. This work was supported by grants 0234960 and 007777 from the National Science Foundation.
Author information
Authors and Affiliations
Corresponding author
Ethics declarations
Competing interests
The authors declare no competing financial interests.
Rights and permissions
About this article
Cite this article
Till, B., Zerr, T., Comai, L. et al. A protocol for TILLING and Ecotilling in plants and animals. Nat Protoc 1, 2465–2477 (2006). https://doi.org/10.1038/nprot.2006.329
Published:
Issue Date:
DOI: https://doi.org/10.1038/nprot.2006.329
This article is cited by
Comments
By submitting a comment you agree to abide by our Terms and Community Guidelines. If you find something abusive or that does not comply with our terms or guidelines please flag it as inappropriate.
