
Abstract
Acomplete quantum-mechanical description of matter and its interaction with the environment requires detailed knowledge of a number of complex parameters. In particular, information about the phase of wavefunctions is important for predicting the behaviour of atoms, molecules or larger systems. In optics, information about the evolution of the phase of light in time1 and space2 is obtained by interferometry. To obtain similar information for atoms and molecules, it is vital to develop analogous techniques. Here we present an interferometric method for determining the phase variation of electronic wave packets in momentum space, and demonstrate its applicability to the fundamental process of single-photon ionization. We use a sequence of extreme-ultraviolet attosecond pulses3,4 to ionize argon atoms and an infrared laser field, which induces a momentum shear5 between consecutive electron wave packets. The interferograms that result from the interaction of these wave packets provide useful information about their phase. This technique opens a promising new avenue for reconstructing the wavefunctions6,7 of atoms and molecules and for following the ultrafast dynamics of electronic wave packets.
Main
The development of intense femtosecond lasers, capable of generating electric fields with strengths comparable to the Coulomb fields in atoms and molecules, has motivated extensive fundamental research in the past twenty years. Ionization and dissociation processes are increasingly well understood, and there have been important spin-offs, such as the development of coherent light sources in the extreme-ultraviolet (XUV) range by high-harmonic emission, in particular the generation of attosecond light pulses3,4. This research field is now beginning to make important contributions in other areas of science. For example, electrons ionized by a strong laser field have been used to probe molecular structure8 and molecular ground-state wavefunctions7. The new idea put forward in our work is to make use of interferences between continuum electron wave packets9 that are prepared by a sequence of attosecond laser pulses. This allows us to probe the dynamics of continuum electrons in an infrared (IR) laser field, to investigate the fundamental process of atomic photoionization and to characterize the electronic wave packet created in the process.
Our method closely resembles the traditional implementation of interferometry in optics, where a light wave E(x) is split into two replicas that travel different paths. The two replicas interfere when they are recombined, and from the interference pattern, |E(x)+E(x)eiδϕ(x)|2∝1+cosδ ϕ(x), the difference in the accumulated phase, δ ϕ(x), in the two paths can be extracted. The interference pattern in this case does not depend on the phase of the initial field, but on the optical path difference. In another implementation, the field itself can be characterized if a ‘shear’ δ x is added to one of the two replicas. If |E(x)|≈|E(x+δ x)| in the region of overlap,

where φ(x) is the phase of E(x). In this case, information about the phase φ(x) can be retrieved. This technique has been applied extensively in optics, for the measurement of wavefronts2 when a spatial shear is induced, and for the determination of the spectral phase of ultrashort optical pulses1,5 when a spectral shear is induced.
The principle of our measurement technique is illustrated, for helium, in Fig. 1. The photoelectron-momentum distribution obtained when a helium atom is ionized by a single attosecond pulse is shown in Fig. 1a. It is a ring-shaped distribution peaked along the direction of polarization of the electromagnetic field10, which here corresponds to the py axis. When an IR field is present at the time of ionization, the momentum distribution is shifted by the amount of momentum transferred from the field to the continuum electron wave packet, as shown in Fig. 1b. Here, the infrared intensity is IIR=3×10¹³ W cm−2 and the momentum transfer is equal to −e A(τ)=1×10⁻²⁴ N s, where A is the vector potential of the IR field, polarized in the same direction (y) as the XUV field, τ is the instant of ionization and e is the electron charge. This effect, which strongly depends on the initial timing11,12, has previously been used in attosecond metrology to determine the characteristics of single attosecond pulses13 as well as of the IR laser field14.

The results of calculations carried out by solving the time-dependent Schrödinger equation in helium within the single active electron approximation. a, The momentum distribution of an electron ionized by a single 180-attosecond 46-eV pulse (shown schematically above the figure). The width of the ring is related to the attosecond pulse bandwidth (11 eV). The blue plus sign indicates the centre of the momentum distribution. In b, the distribution is displaced because the ionization occurs in the presence of an IR laser field that is linearly polarized along the y axis. The momentum shift is equal to −e A(τ), where A is the vector potential, indicated in red above the figure, and τ is the instant of ionization. In c,d, the photoionization is due to a sequence of two attosecond pulses separated by half the IR laser cycle, as shown schematically above the figure. In c, the ionization occurs at zeros of A(τ) and the interference structure depends on the difference in accumulated phase between the electron wave packets. It consists of circles, as shown by the white line, centred at (px=0,py=−e A(τ)/π). In d, the ionization occurs at a maximum or minimum of A(τ), and there is a momentum shear between the wave packets that affects the interference pattern in the region of overlap. The difference in accumulated phase between the two electron wave packets is proportional to the integral of the vector potential and is illustrated by the orange area at the top of c,d.
When the atom is ionized by two attosecond pulses separated by half the IR laser period, two electron wave packets are created which will interfere where their momentum distributions overlap. This is very similar to the traditional Young’s double-slit experiment, where the slits here are provided by the double-attosecond pulse excitation. When the electron wave packets are formed in the presence of an IR field at times when the vector potential is zero (Fig. 1c), they have approximately the same final momentum distributions but different accumulated phases due to the different amount of time spent in the dressed continuum. As explained in the Supplementary Information, using a semiclassical formulation15,16 for δ-pulses, the phase difference between the two interfering wave packets can be written as
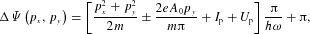
where m is the electron mass, ħ is the Planck constant divided by 2p, ω is the IR frequency, Ip is the ionization energy, A0 is the amplitude of the vector potential, and Up=e2A02/4m is the ponderomotive energy. The total energy absorbed in the ionization process is  . As shown in Fig. 1c, the interference pattern, obtained by solving the time-dependent Schrödinger equation in helium for 180-attosecond pulses, follows the semiclassical predictions (indicated by the white circle) remarkably well. This shows that neither the presence of the ion core, modifying the electron dynamics, nor the non-zero length of the attosecond pulses, significantly affect the interferogram, which consists of circles centred at (px=0,py=±2e A0/π). The sign depends on the direction (up or down) of the vector potential during the electron trajectory (in Fig. 1c, it is positive). The position of the centre of the circles can be used to determine the intensity of the IR field, and their radii allow us to cross-check the value of the ponderomotive shift Up (here equal to ≈1.8 eV). However, no information about the phase of the ‘initial’ continuum electron wave packet can be deduced. (‘Initial’ here and throughout the text refers to the wave packet created in the absence of an infrared laser field.)
When the attosecond pulses instead coincide with the maxima and minima of the vector potential (Fig. 1d), the momentum transfer from the IR field is maximal and opposite in direction for the two wave packets. The difference in accumulated phase between the two ionization events due to the interaction with the field is equal to zero in this case. The phase that governs the interference pattern can be written as (see the Supplementary Information)

This allows us to determine the difference between the phases of the initial electron wave packet (φ) at two different positions in momentum space, in the region where the two final momentum distributions overlap. To illustrate this point, the interference pattern inside the white rectangle in Fig. 1d is analysed (Fig. 2a). The phase  can be extracted from the interferometric measurement by using a Fourier-transform method17, allowing us to extract the phase of the oscillating fringes at different points in momentum space using straightforward mathematical manipulations. The most remarkable feature exhibited in the phase of the fringes, represented in Fig. 2b, is the abrupt change of phase by π at py≈±e A0, which corresponds to the momentum shift induced by the IR field. In Fig. 2c, we extract
  . Δφ is approximately constant, equal to π for |py|≤|e A0| and 0 elsewhere. This indicates that the phases of the initial wave packet at
  and
and  differ by 0 or π, depending on whether the momenta are located on the same side or on opposite sides of the py=0 plane (see the schematic diagram) respectively. This result is expected for photoionization of the helium ground state, and leads to a p-continuum wavefunction which changes sign across the py=0 plane.

Analysis of a, the theoretical results obtained in helium when ionization occurs at times such that the vector potential is maximum. The dotted lines indicate the region of overlap where the Fourier analysis is carried out. b, ΔΨ. c, Δφ. The sampling is illustrated by a schematic diagram. A phase difference of 0 is obtained when the interference measurement involves two momentum components lying on the same side of the py=0 plane, and π when the two momentum components lie on opposite sides.
More generally, our interferometric technique should allow us to visualize any phase variation of the initial continuum wave packet that is in the region of overlap of the final momentum wave packets. However, in this proof-of-principle example, the phase retrieval is somewhat limited. To improve our technique towards a more-complete phase reconstruction, we must (1) use a momentum shear in two perpendicular directions, as in lateral-shearing interferometry2, to enable the reconstruction of the phase in two dimensions; (2) use a combination of small momentum shear to obtain a larger region of overlap and to better sample the momentum distribution, and large momentum shear to probe the difference of phase between the different parts of the electron wave packet.
In our experiment (Fig. 3a), a train of attosecond pulses, generated through high-order harmonic generation in argon18, is used to ionize argon, resulting in a train of electron wave packets with 200±30-attosecond duration, a central kinetic energy of 11 eV and a bandwidth of 11 eV. The pulse duration of the electron wave packets are determined by a RABITT (reconstruction of attosecond beating by interference of two-photon transition) analysis3. The IR field, which accelerates the continuum electron wave packets, is a fraction of the laser beam used to generate the harmonics. The key results of this work are presented in Fig. 3b,c, where two-dimensional cuts through the three-dimensional momentum distributions19,20 obtained in argon using a velocity-map imaging technique21,22 are presented for two delays between the XUV and IR fields. The distributions are more complex than those presented in helium. This is partly because of the properties of our attosecond pulses, which are generated as a train, containing more than two pulses. An additional interference structure is superposed on that described previously, which consists of circles centred at the origin, simply expressing energy conservation. This interference effect is very similar to that leading to electron peaks separated by ħω, when atoms are ionized by intense laser pulses23,24. In addition, argon has three different initial states, 3p,m=0,±1 and, for one-photon absorption, several possible final states with s or d symmetry. The interferences discussed above are, however, clearly visible. Figure 3b shows a complex interference structure, with three sets of circles that have different origins: (px=0,py=0) (large circle), (px=0,py=±2e A0/π) (small circles). An analysis of this interference pattern allows us to determine the IR intensity to be IIR=2.5×10¹³ W cm−2, a value that agrees well with that estimated in our experimental conditions.

a, The principle of our experiment. An IR laser field and a train of attosecond pulses are focused into the sensitive region of a velocity-map imaging electron spectrometer, where they intersect a beam of Ar atoms. The polarizations of the IR and XUV fields are parallel to each other, and are perpendicular to the detection axis of the velocity-map imaging electron spectrometer. Electrons created in the interaction region are extracted using a high voltage d.c. electric field and are accelerated towards an imaging microchannel plate assembly, then towards a phosphor screen and a charge-coupled device camera system that record the positions of the electron impacts on the detector. The three-dimensional velocity distribution at a given delay between the XUV and IR fields is recovered from the measured projection using an iterative procedure. b,c, Experimental data at two different relative delays between the attosecond pulses and the IR laser field. The attosecond pulses coincide with the zeros of the vector potential in b and with its maxima and minima in c. Both cases show complex interference patterns. In b, the fringes resulting from the interference of consecutive electron wave packets are circles centred on the py axis, as shown by the small circles centred on the white crosses. Those owing to interferences between electron wave packets separated by one IR cycle are circles centred at the origin, as shown by the large circle centred on the blue plus sign. In c, the most remarkable effect is the pronounced interference structure crossing the px axis, as shown inside the white rectangle. The upper and lower parts of the momentum distribution obtained at the maximum energy transfer delay are not shown in this figure, where the highest electron energy is ∼25 eV.
The complexity of the interference pattern obtained in Fig. 3c, combined with experimental statistical noise, prevent us from carrying out an analysis as in Fig. 2, except close to the px axis. This is equivalent to discussing the behaviour of the interference pattern in the region outlined by the white rectangle. In Fig. 4a, we compare these interference fringes with theoretical results obtained in argon for similar conditions as in the experiment (a train of Fourier-transform-limited 190-attosecond pulses, centred at 27-eV energy, and an IR intensity equal to IIR=2.5×10¹³ W cm−2). In this case, the momentum distribution measured is the incoherent sum of two contributions, originating from the 3p m=0 and the m=±1 states. Interestingly, because the corresponding ground-state wavefunctions have different symmetry properties (antisymmetric and symmetric relative to py=0, respectively), the interference fringes will be shifted by π along the px axis. Theoretical results obtained by separating the two contributions (Fig. 4b) clearly show this phase difference. Our experimental (and theoretical) results show that in this region, photoionization of argon is dominated by the contributions from the m=±1 states.

a, Comparison of experimental (top) and theoretical (bottom) results obtained in argon in similar conditions, in the region of overlap of the two electron wave packet final momenta distributions. b, The theoretical results for only one ground-state wavefunction, m=0 (top) and m=1 (bottom). The blue and white dots indicate the position of the maxima and minima of the interference fringes on the px axis. Together with the dashed lines, they help to show that the interference patterns are inverted. For two momenta lying on opposite sides of the py=0 plane, the phase difference of the intial electron wave packet is 0 for m=0 (top) and π for m=1 (bottom).
By increasing or decreasing the laser intensity, by varying the delay while taking the added accumulated phase due to the interaction with the IR field into account, and by using different polarization states for the XUV and IR light fields combined with a polarization-independent detection technique21, more information could be obtained in a larger region in momentum space. This opens exciting possibilities for investigating the continuum and ground-state electronic wavefunctions of complex, chemically relevant molecules and also for following the dynamics of time-dependent superposition of states.
References
Iaconis, C., Wong, V. & Walmsley, I. A. Direct interferometric techniques for characterizing ultrashort optical pulses. IEEE J. Sel. Top. Quantum Electron. 4, 285–294 (1998).
Bates, W. J. A wavefront shearing interferometer. Proc. R. Phys. Soc. 59, 940–950 (1947).
Paul, P. M. et al. Observation of a train of attosecond pulses from high harmonic generation. Science 292, 1689–1692 (2001).
Hentschel, M. et al. Attosecond metrology. Nature 414, 509–513 (2001).
Quéré, F. et al. Attosecond spectral shearing interferometry. Phys. Rev. Lett. 90, 073902 (2003).
Weinacht, T. C., Ahn, J. & Bucksbaum, P. H. Measurement of the amplitude and phase of a sculpted Rydberg wave packet. Phys. Rev. Lett. 80, 5508–5511 (1998).
Itatani, J. et al. Tomographic imaging of molecular orbitals. Nature 432, 867–872 (2004).
Kanai, T., Minemoto, S. & Sakai, H. Quantum interference during high-order harmonic generation from aligned molecules. Nature 435, 470–474 (2005).
Wollenhaupt, M. et al. Interferences of ultrashort free electron wave packets. Phys. Rev. Lett. 89, 173001 (2002).
Manson, S. T. & Cooper, J. W. Angular distribution of photoelectrons: Outer shells of noble gases. Phys. Rev. A 2, 2170–2171 (1970).
Kienberger, R. et al. Steering attosecond electron wave packets with light. Science 297, 1144–1148 (2002).
Johnsson, P. et al. Attosecond electron wave packet dynamics in strong laser fields. Phys. Rev. Lett. 95, 013001 (2005).
Kienberger, R. et al. Atomic transient recorder. Nature 427, 817–821 (2004).
Goulielmakis, E. et al. Direct measurement of light waves. Science 305, 1267–1269 (2004).
Lewenstein, M., Balcou, Ph., Ivanov, M. Yu., L’Huillier, A. & Corkum, P. B. Theory of high-harmonic generation by low-frequency laser fields. Phys. Rev. A 49, 2117–2132 (1994).
Quéré, F., Mairesse, Y. & Itatani, I. Temporal characterization of attosecond XUV pulses. J. Mod. Opt. 52, 339–353 (2005).
Takeda, M., Ina, H. & Kobayashi, S. Fourier-transform method of fringe-pattern analysis for computer-based topography and interferometry. J. Opt. Soc. Am. 72, 156–160 (1982).
López-Martens, R. et al. Amplitude and phase control of attosecond pulses. Phys. Rev. Lett. 94, 033001 (2005).
Aseyev, S. A., Ni, Y., Frasinski, L. J., Muller, H. G. & Vrakking, M. J. J. Attosecond angle-resolved photoelectron spectroscopy. Phys. Rev. Lett. 91, 223902 (2003).
Vrakking, M. J. J. An iterative procedure for the inversion of two-dimensional ion/photoelectron imaging experiments. Rev. Sci. Instrum. 72, 4084–4089 (2001).
Dörner, R. et al. Cold target recoil ion momentum spectroscopy: a ‘momentum microscope’ to view atomic collision dynamics. Phys. Rep. 330, 95–192 (2000).
Eppink, A. T. J. B. & Parker, D. H. Velocity map imaging of ions and electrons using electrostatic lenses. Application in photoelectron and photofragment ion imaging of molecular oxygen. Rev. Sci. Instrum. 68, 3477–3484 (1997).
Agostini, P., Fabre, F., Petite, G. & Rahman, N. K. Free-free transitions following six-photon ionization of xenon atoms. Phys. Rev. Lett. 42, 1127–1130 (1979).
Lindner, F. et al. Attosecond double slit experiment. Phys. Rev. Lett. 95, 040401 (2005).
Acknowledgements
This research was supported by Marie Curie Intra-European Fellowships (MEIF-CT-2004-009268, MEIF-CT-2003-500947), the Marie Curie Research Training Networks XTRA (MRTN-CT-2003-505138) and PICNIC (HPRN-2002-00183), the Integrated Initiative of Infrastructure LASERLAB-EUROPE (RII3-CT-2003-506350) within the 6th European Community Framework Programme, the Knut and Alice Wallenberg Foundation, the Swedish Science Council and the National Science Foundation through grant PHY-0401625. K.V. is on leave from the Department of Optics and Quantum Electronics, University of Szeged, Szeged, Hungary. The research of Y.N., F.L., M.K., J.K. and M.J.J.V. is part of the research program of the ‘Stichting voor Fundamenteel Onderzoek der Materie (FOM)’, which is financially supported by the ‘Nederlandse organisatie voor Wetenschappelijk Onderzoek (NWO)’. We thank T. Ruchon and M. Lewenstein for fruitful discussions.
Author information
Authors and Affiliations
Corresponding author
Ethics declarations
Competing interests
The authors declare no competing financial interests.
Supplementary information
Rights and permissions
About this article
Cite this article
Remetter, T., Johnsson, P., Mauritsson, J. et al. Attosecond electron wave packet interferometry. Nature Phys 2, 323–326 (2006). https://doi.org/10.1038/nphys290
Received:
Accepted:
Published:
Issue Date:
DOI: https://doi.org/10.1038/nphys290
This article is cited by
-
Quantum state holography to reconstruct the molecular wave packet using an attosecond XUV–XUV pump-probe technique
Scientific Reports (2020)
-
Asymmetries in ionization of atomic superposition states by ultrashort laser pulses
Scientific Reports (2020)
-
Attosecond interferometry with self-amplified spontaneous emission of a free-electron laser
Nature Communications (2017)
-
Sub-10-fs control of dissociation pathways in the hydrogen molecular ion with a few-pulse attosecond pulse train
Nature Communications (2016)
-
Extreme ultraviolet high-harmonic spectroscopy of solids
Nature (2015)
