The Nature Index is a database of author affiliations and institutional relationships. The index tracks contributions to research articles published in 82 high-quality natural-science journals, chosen by an independent group of researchers.
The Nature Index provides absolute and fractional counts of article publication at the institutional and national level and, as such, is an indicator of global high-quality research output and collaboration. Data in the Nature Index are updated regularly, with the most recent 12 months made available under a Creative Commons licence at natureindex.com. The database is compiled by Nature Portfolio.
Nature Index metrics
The Nature Index uses Count and Share to track research output. A country/territory or an institution is given a Count of 1 for each article that has at least one author from that country/territory or institution. This is the case regardless of the number of authors an article has, and it means that the same article can contribute to the Count of multiple countries/territories or institutions.
To glean a country’s, territory’s or an institution’s contribution to an article, and to ensure that they are not counted more than once, the Nature Index uses Share, a fractional count that takes into account the share of authorship on each article. The total Share available per article is 1, which is shared among all authors under the assumption that each contributed equally. For instance, an article with 10 authors means that each author receives a Share of 0.1. For authors who are affiliated with more than one institution, the author’s Share is split equally between each institution. The total Share for an institution is calculated by summing the Share for individual affiliated authors. The process is similar for countries/territories, although complicated by the fact that some institutions have overseas labs that will be counted towards host country/territory totals.
Adjusted Share accounts for the small annual variation in the total number of articles in the Nature Index journals. It is arrived at by calculating the percentage difference in the total number of articles in the Index in a given year relative to the number of articles in a base year and adjusting Share values to the base year levels.
Natureindex.com
Users of natureindex.com can search for specific institutions or countries and generate their own reports, ordered by Count or Share.
Each query will return a profile page that lists the country or institution’s recent outputs, from which it is possible to drill down for more information. Articles can be displayed by journal, and then by article. Research outputs are organized by subject area. The pages list the institution or country’s/territory’s top collaborators, as well as its relationship with other organizations. Users can track an institution’s performance over time, create their own indexes and export table data
This supplement
The Nature Index 2021 Science Cities supplement is based on data from natureindex.com, covering articles published from 1 January 2015 to 31 December 2020. The analysis uses article share (Share) as the primary metric, with time series figures adjusted to 2020 levels. Each city’s Share is calculated by summing the Share of affiliated institutions located in the city. For institutions spanning multiple cities, such as CAS, entities were assigned to the city where they are located.
Nature Index 2021 Science cities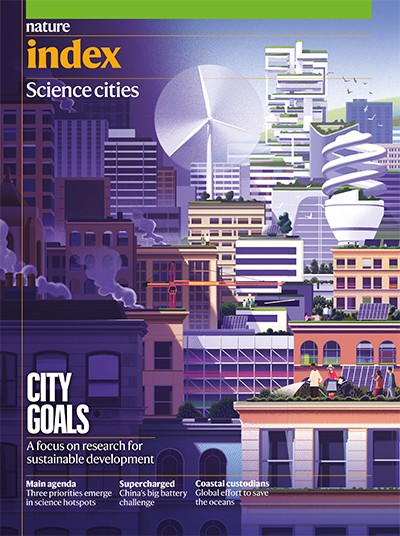
For a selection of the most populous conurbations with significant output in the index in the United States, Canada, Japan, South Korea, India and Europe, we defined boundaries of metropolitan areas based on official specifications from census bureaus, statistical offices, government offices, or as described in legal documents. The specifications typically group adjacent areas that have a high degree of social and economic integration, as measured by commuting ties. When an important institution with strong connections to institutions in the city was situated just outside the metropolitan area we adjusted the boundary to encompass the institution.
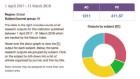
In order to track research outputs that are relevant to UN’s 17 Sustainable Development Goals (SDGs), the SDG classifiers available via Digital Science’s Dimensions database was used. The Share and Count of the related Nature Index articles were filtered and tallied with respect to all and individual SDGs.
A total of 12 tables have been used for showcasing the leading 200 cities by overall Share, as well as the leading cities in the natural sciences. Based on all-SDG Share (2015–20) and the change in SDG Share between 2015 and 2020, the leading 200 cities and top 50 rising cities are displayed respectively. The leading ten institutions by Share in 2020 in each of the five leading cities, namely Beijing, the New York metropolitan area, the Boston metropolitan area, the San Francisco Bay Area and Shanghai, are also included.
 Sustainable Development Goals research speaks to city strengths and priorities
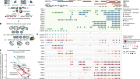
 Tracking 20 leading cities’ Sustainable Development Goals research
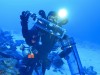 How cities are collaborating to safeguard oceans
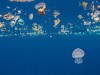 Rising tide of floating plastics spurs surge in research
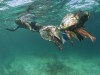 Coral conservation strikes a balance
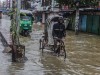 Uneven spread of research leaves poorer cities short of solutions
 Pursuit of better batteries underpins China’s lead in energy research
 How Belo Horizonte’s bid to tackle hunger inspired other cities
 New York bids to level the playing field in a metropolis of inequality